Please do not start working on this until we discuss it in class. You should work on this lab individually (without the use of AI), and your answers should all be your own.
The life cycle of a eukaryotic cell (or cell cycle as it is known) is divided into characteristic phases. During G1, S, and G2 (collectively known as interphase) the cell grows, replicates its DNA and prepares for division. After the successful completion of interphase, the cell is then able to undergo mitosis, the division of genetic material and the nucleus, and cytokinesis, the division of the cytoplasm.
Each phase of mitosis is characterized by certain key events, and all eukaryotic organisms go through a very similar set of mitotic stages. In this lab, you will observe mitosis in onion root tip cells that have been dyed to make their DNA visible. The objective of the lab is to become familiar with the appearance of each phase of mitosis and to gain an appreciation of the relative duration of each phase of the cell cycle.
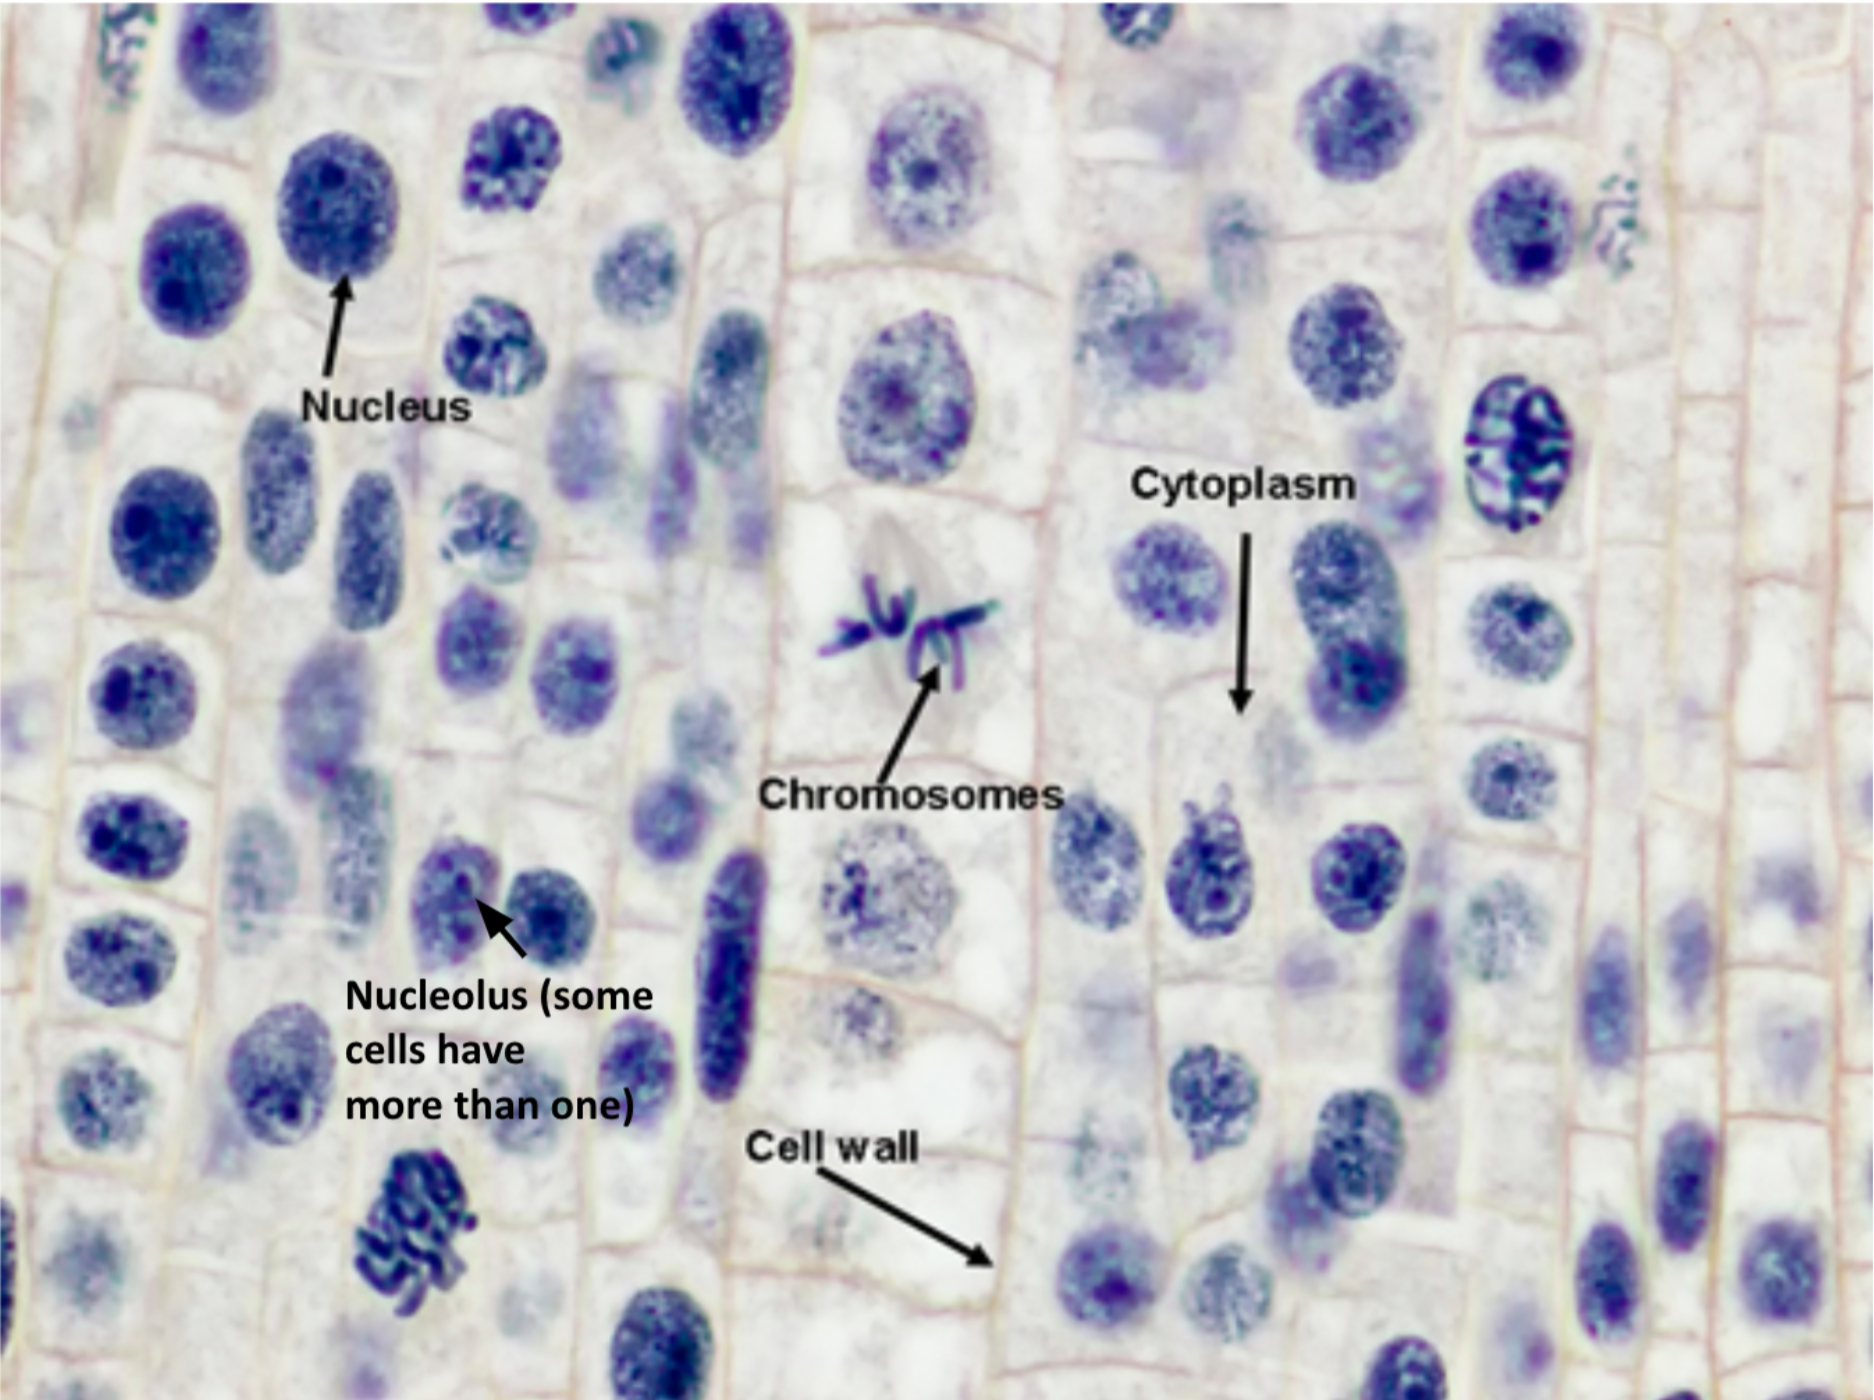
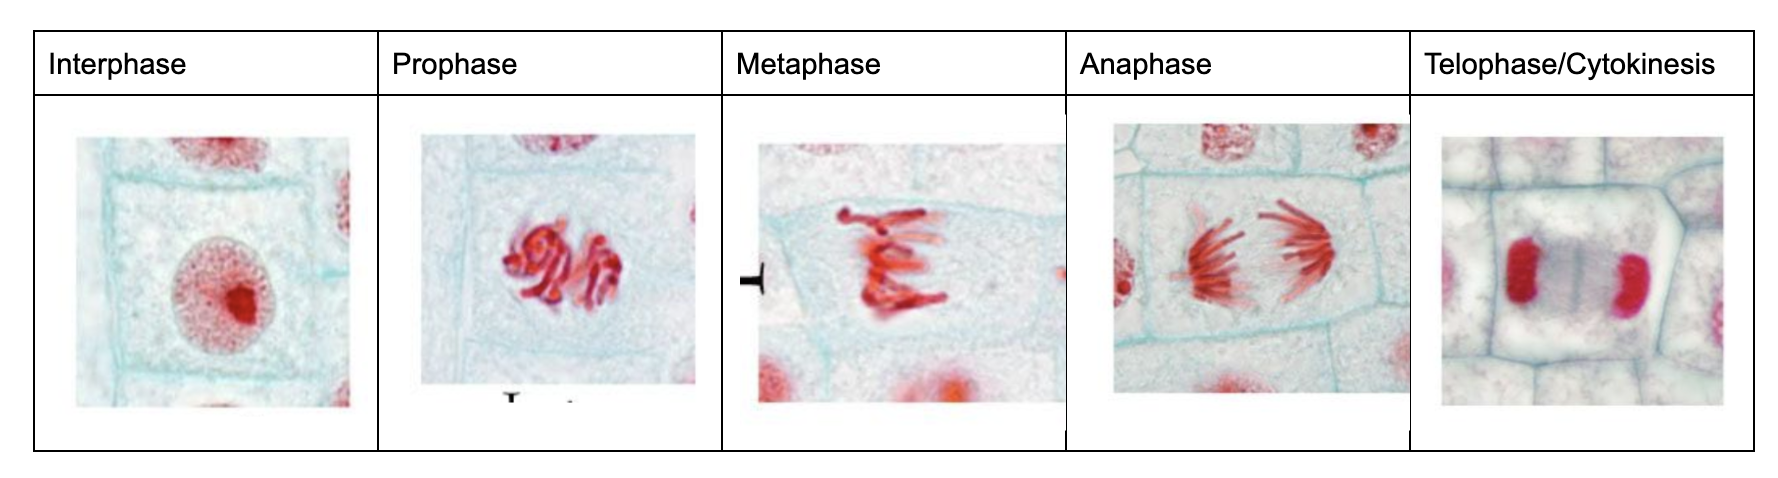
Below are two images that might be helpful when going through this lab. The first is an image labeling the parts of the cells. The second is an image showing you the different stages of the cell cycle (what they look like in an onion cell). Click on the "zoom in" in the upper right to see these images fully/closely.
Now that you know what the cells look like when they are undergoing each step in the cell cycle, you are going to look at the following images and count what number of cells are in each stage.
You should count a total of 100 cells (it seems like a lot but it’ll go by faster than you think). For each cell write what stage of the cell cycle they are in in the table below (it is the first question in the post activity questions below). Click zoom in to see the whole picture.
After you have finished counting these cells, answer the questions that follow.
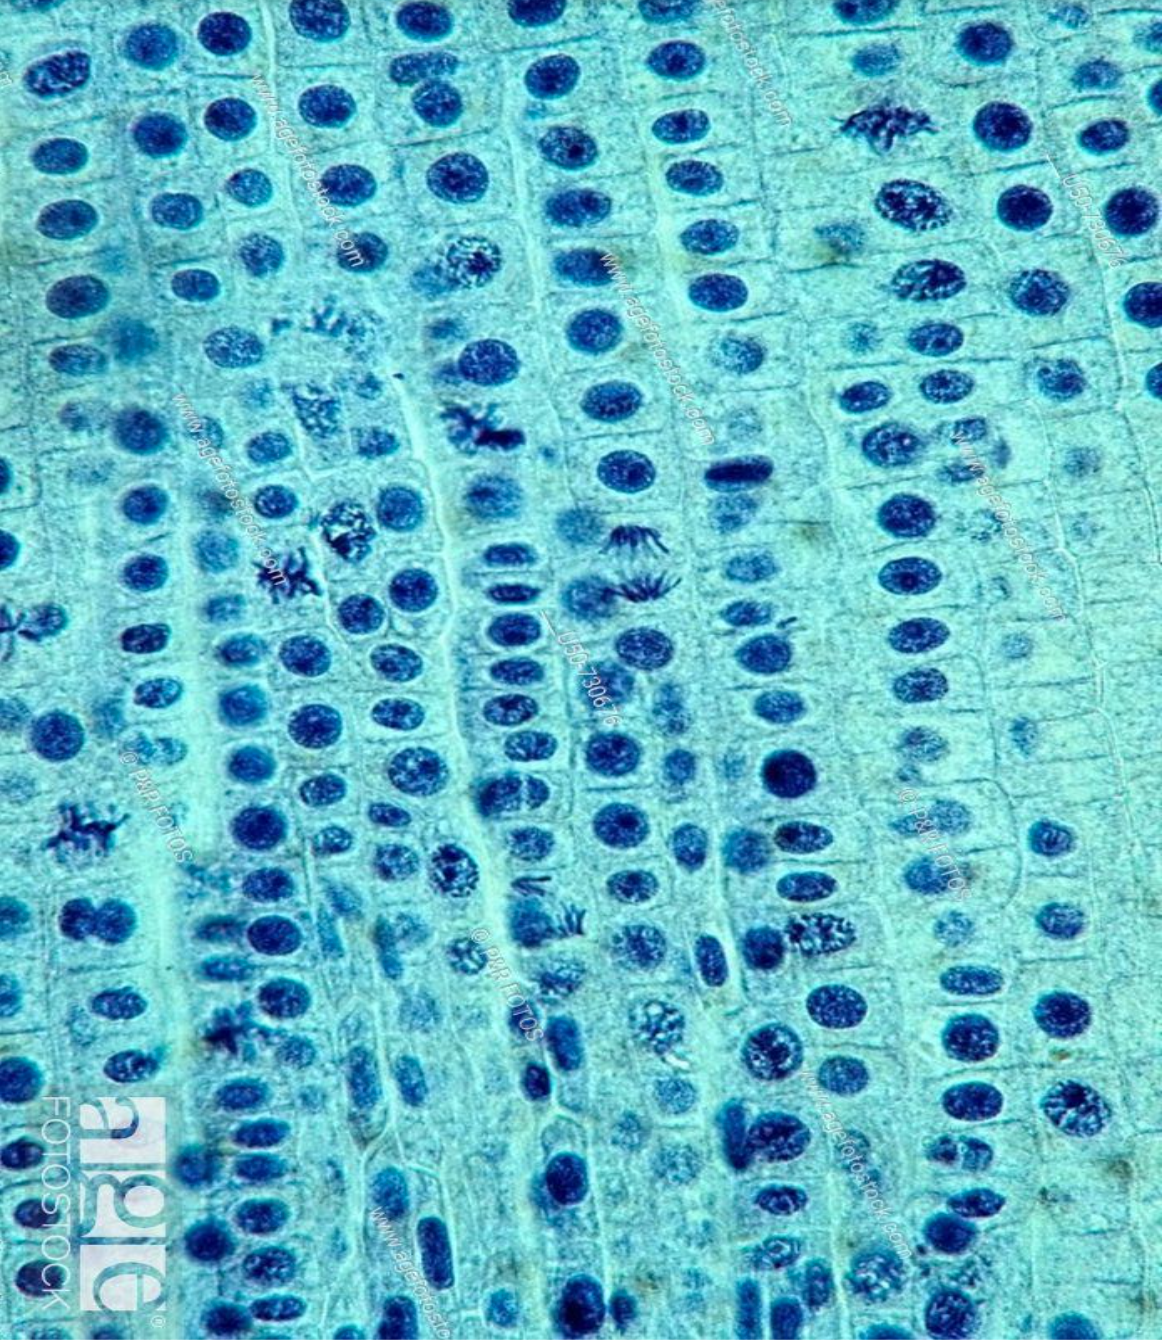
Use the text function to fill in this table. Your numbers should add up to 100.
Linked to the assignment on Google Classroom is a set of slides for you to paste pictures of each cell type (I'll explain this in class). Click "yes" for this question when you are finished. This is the only question for this post lab that you are using the microscope for. The rest of the questions are using the data from question #1.
Using a Google Sheet make a pie graph to illustrate what percentage of the 100 cells that you counted for the first question are in each phase. Be sure to include all necessary elements (like a very specific title, key, etc.). Take a screenshot of your graph and paste it here. Be sure to crop the picture so that you only see the graph/title/etc. and not your background or the rest of the Google Sheet.
If the entire process of cell division required 1 day, calculate the number of hours a cell would spend in each phase of the cell cycle (ex: if there are 10 cells in prophase out of 100 cells counted, the cell spends 10% of its time in prophase, so you would multiply 24 hours by 0.1 to figure out how long out of 24 hours the cell spends in prophase). Round to 1 decimal place, and no need to show your work. Use the text function to fill in this table. The numbers here should add up to 24.
In which phase does a healthy cell spend the most time? Why? Look back at your notes to see what happens in this phase. You can write 2-3 sentences for this answer.
How do metaphase and anaphase cells differ in their appearance in the onion cells? Why do those cells look different? In this answer explain what is happening in these two phases. You can write 2-3 sentences for this answer.
How do anaphase and telophase/cytokinesis cells differ in their appearance in the onion cells? Why do those cells look different? In this answer explain what is happening in these two phases. You can write 2-3 sentences for this answer.