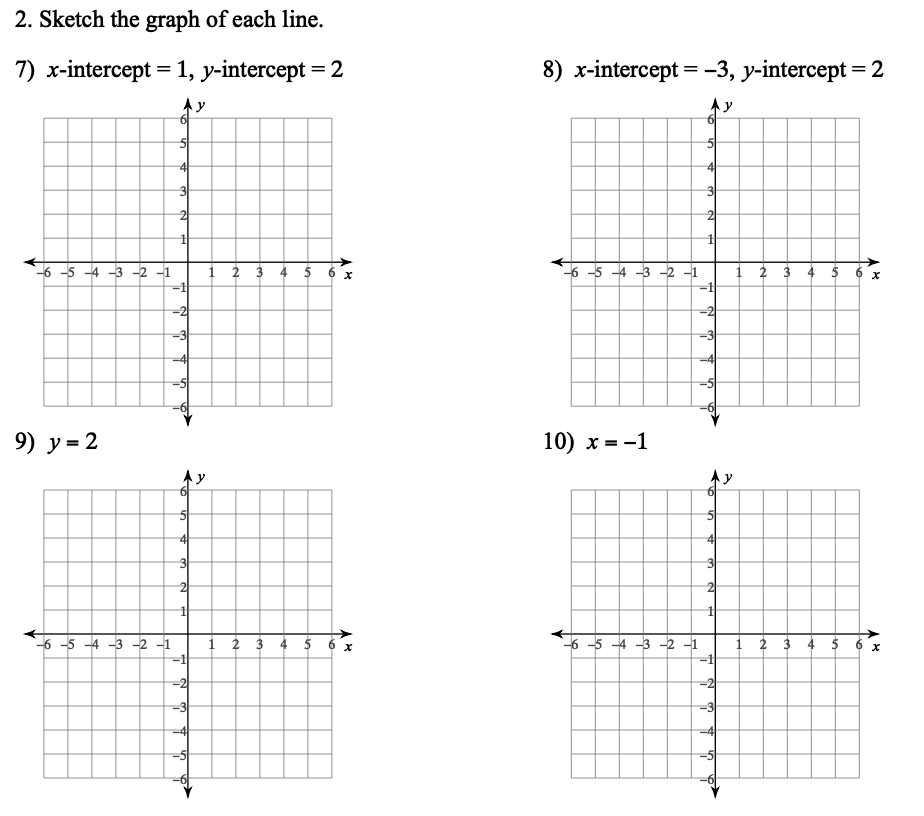
1
State your answer as a point (x,0) or (0,y).
State your answer as a point (x,0) or (0,y).
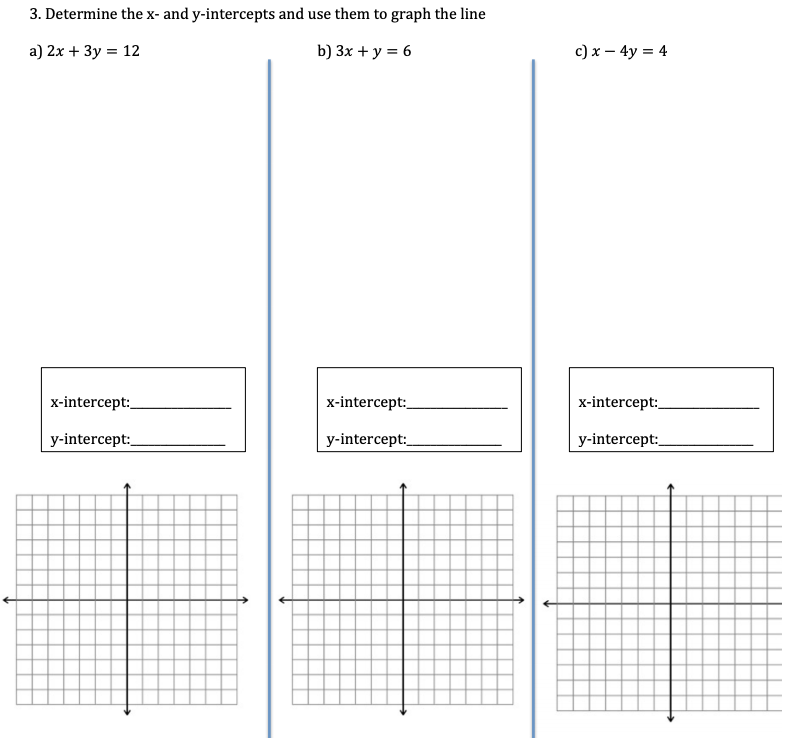
1
State your answer as a point (x,0) or (0,y).
State your answer as a point (x,0) or (0,y).
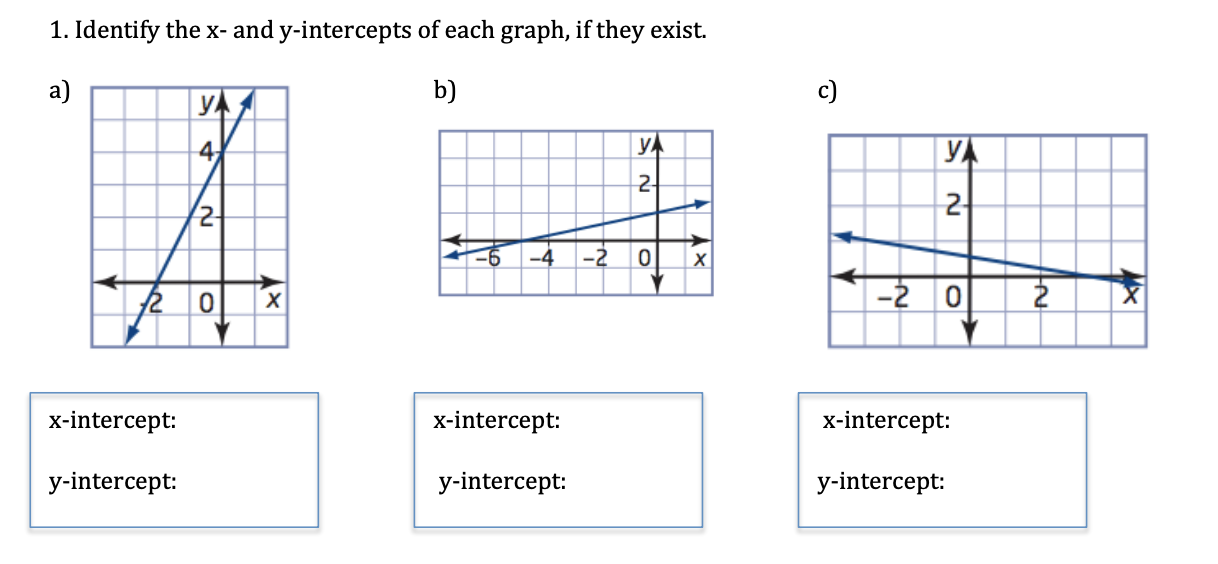
1
State your answer as a point (x,0) or (0,y).
State your answer as a point (x,0) or (0,y).
1
1
1