Log in
Sign up for FREE
arrow_back
Library
GSS Distance vs Time Graphs #1
By Joseph Stitt
star
star
star
star
star
Share
share
Last updated over 4 years ago
5 questions
Add this activity
1
zoom_in
1
1
zoom_in
1
Question 1
1.
What does it mean if an object is traveling a constant speed?
The object is speeding up
The object is slowing down
The object is not moving
The object is traveling the same speed- not speeding up or slowing down
Question 2
2.
Using the graph, what can you tell about Runner #1 (BLUE LINE)?
They are traveling at a constant speed
They are speeding up
They are slowing down
They are not moving
Question 3
3.
Using the graph, what can you tell about Runner #2 (RED LINE)?
They are traveling at a constant speed
They are speeding up
They are slowing down
They are not moving
Question 4
4.
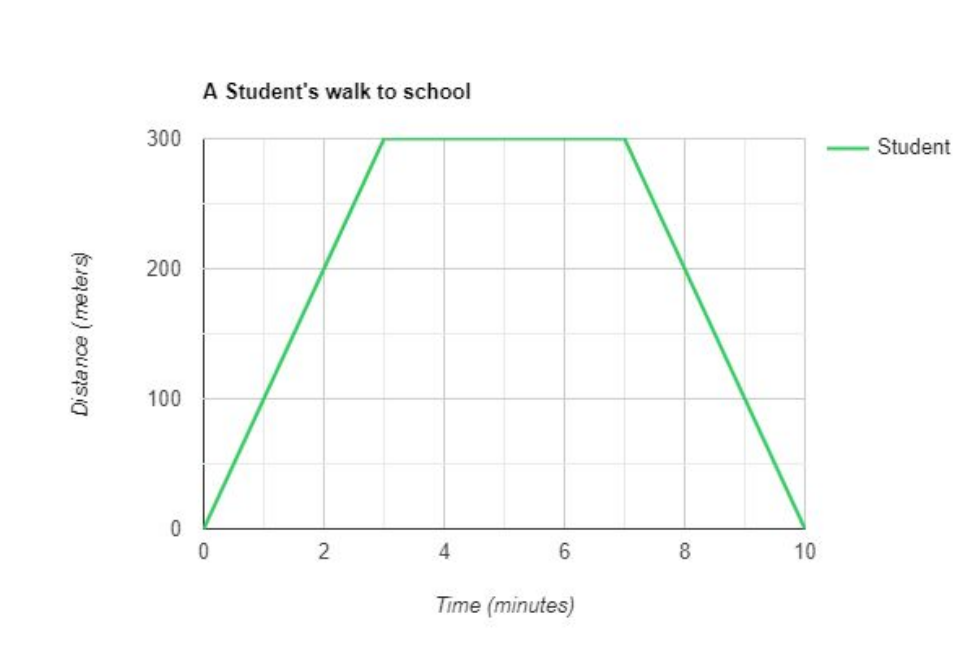
Using the graph, what can be determined about the student's walk to school between 3 minutes and 7 minutes?
They slowed down
They stopped moving
They sped up
They traveled a constant speed
zoom_in
1
Question 5
5.
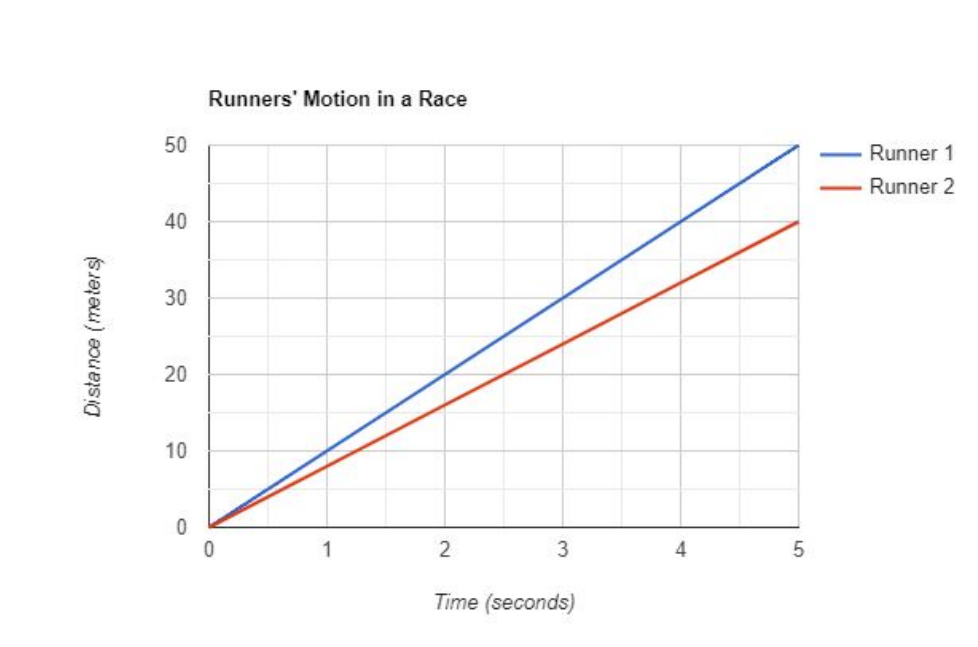
Using the graph, how can you comapre the two runners?
Runner #2 runs faster than Runner #1
Runner #1 runs faster than Runner #2
They run the same speed
They travel the same distance
Runner #2 runs futher than #1