7
Link to google sheets: Paste a copy of your data here.
Link to google sheets: Paste a copy of your data here.
After you submit you will not be able to edit your answers! This is essentially a test, just one that you can work with your lab group on. I will not be able to give confirmation on if an answer is correct, just guidance to better understanding the question.
After you submit you will not be able to edit your answers! This is essentially a test, just one that you can work with your lab group on. I will not be able to give confirmation on if an answer is correct, just guidance to better understanding the question.
Purpose: To determine the velocity of a horizontal projectile and predict the distance that a marble will travel horizontally before striking the floor when launched horizontally.
Using the materials offered and evaluating the purpose above please write the materials, procedure and draw a diagram of your experiment.
Hypothesis: Write a proper hypothesis in 'If/Then' statement based on the purpose of the lab
Materials:List all materials that were used to complete the lab exercise.
Procedure: Write the procedure for the lab using numbered steps. Be clear and concise. Draw a diagram of your set up in the show your work section
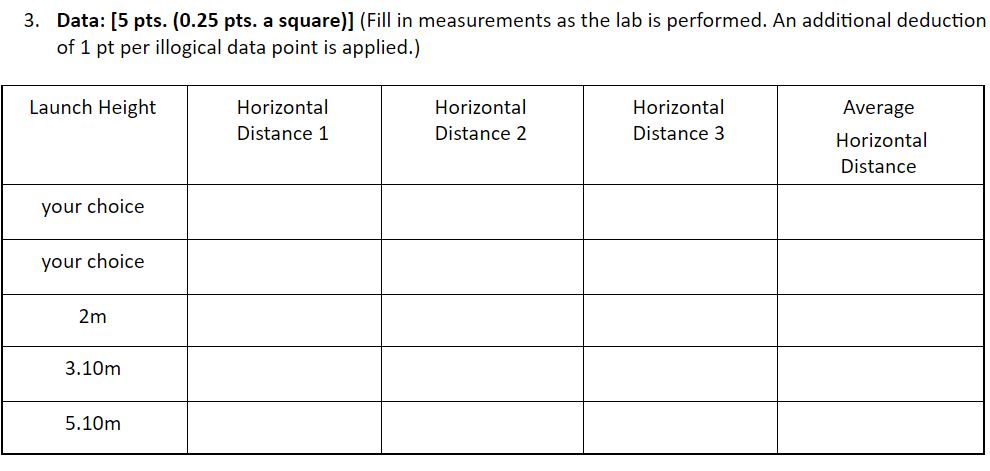
Link to google sheets: Paste a copy of your data here.
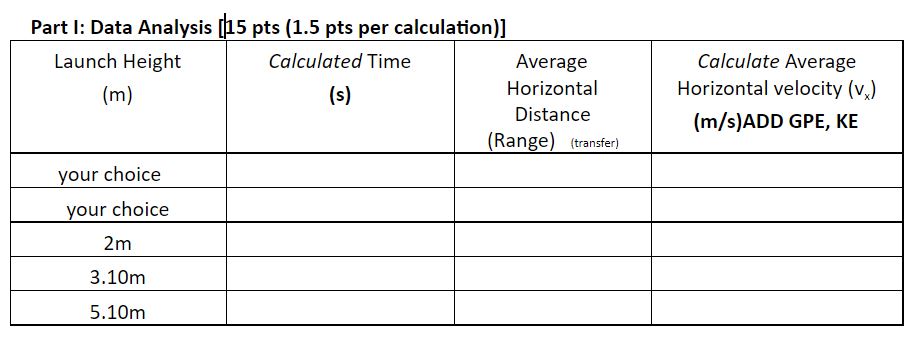
Paste a copy of your calculation data table here.
Part I: Data Analysis Graph
Graph the horizontal distance vs time to determine the Average Horizontal Velocity of the projectile
Check your graph
- Is the title specific including the dependent variable and the independent variable?
- Are the axis labeled both with the variable and the unit?
- Are the axis labeled by values from least to greatest data points with a proper scale?
- Do the data points cover the entire graph provided?
- Does the Best Fit Line represent the expected relationship?
Paste an image of your graph.
Calculate the slope of your best fit line to determine the average velocity of your projectile.
Gravitational Potential energy should be the final Kinetic energy of the object at the bottom of the drop.
Which of the following heights has the greatest potential energy.
After the marble is launched, which height created the greatest Kinetic energy just before the object hits the ground
Would a projectile launched with a greater horizontal velocity affect the time of flight? Explain
Would a greater horizontal velocity affect the horizontal distance traveled? Explain.
Would a projectile launch with a greater angle affect the range distance? Explain.
The realtionship between time and height is linear.
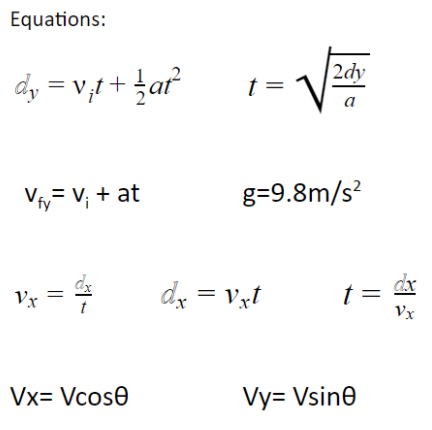
What was the horizontal velocity of the Marble as it exits the Marble Launcher when dropped from a 2 meter height? (see your data)
What is the initial vertical velocity of the Marble as it exits a horizontal Marble Launcher when dropped from a 2 meter height?
What is the final vertical velocity of the Marble just before it impacts the ground after being launched from a horizontal Marble Launcher when dropped from a 2 meter height?
Check those that are true for a marble after it is launched from a horizontal marble launcher at a 2 meter height. (neglect air resistance)
If a baseball is launched through a similar launcher at the same height as a marble. Gravitational potential energy for the baseball is
If a baseball is launched through a similar launcher at the same height as a marble. The baseball's kinetic energy just before impact is
Write a 3 paragraph CER Conclusion on a separate sheet of paper.
C = Claim: Statement about the results of the experiments based on the original purpose.
Must relate to your Hypothesis which relates to the Purpose.
Full hypothesis omitting the ‘if’ and ‘then’ based on appropriate data that describes the relationship between the dependent and independent variables.
Define all terms, variables, concepts, and relationships.
Do not include data or conclusions. Explain the lab without including all details of the procedure.
E = Evidence: Evidence/ data/observations that supports the claim.
List ALL data that supports your claim. Include 3 ordered pairs that illustrate the trends the graph illustrates; Utilize your answers from the appropriate data tables and lab questions.
Include 3 ordered pair data points and appropriate data from the Data Collection and Data Analysis Sections.
Explain the trends in the data without listing reasoning or a conclusion.
R = Reasoning: Use reasoning to link your evidence to your data.
Clearly explain how or why the evidence supports the claim. justifying the link of the scientific principles of the claim to the evidence.
List at least 3 sources of error only 1 of which can be human source of error.
Utilize your answers from the appropriate post lab questions.
Proof Read!
Does this make sense to someone that has not taken this class?
Did you clearly illustrate your point?
Can your conclusion stand alone and give a clear view of the lab conclusions?
No pronouns! Be specific. Alter “it is rolling” to “The ball is rolling”
Present tense only! Science is timeless. No past or future tense. “We measured the distance” to “the distance is measured”
Do not reference the lab. Reference only the scientific principles. Alter “In the lab” to “the evaluation of.”
Shared conclusions will split the grade with all common conclusions.
Write your CER here. We are not using No Red Ink (besides as bonus points). This is a major grade so I encourage you to have a peer review your work before submission