APES FRQ Practice – Human Population
star
star
star
star
star
Posljednje ažuriranje over 4 years ago
8
1
1
1
1

1
1
1
1
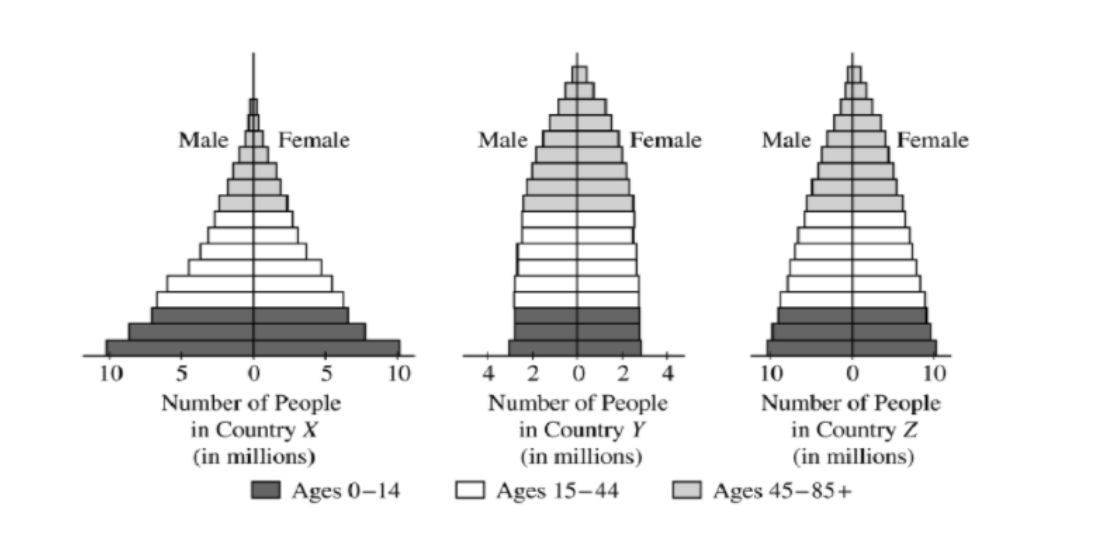
Which of the three countries has the largest rate of population growth? Which has the smallest? Explain.
Compare the infant mortality rates that are likely in Countries X and Y. Explain your reasoning.
Describe the changes in both the birth rate and the death rate for a country making the transition from a preindustrial society to an industrial society.
Describe one incentive that the government of a country could offer is citizens that would favor a reduction in the growth rate of its population. Explain how this incentive would work, and describe one possible drawback.
FRQ #2
A certain financial country called Industria is tracking its population data. In 1855, the first year vital statistics were reported for the country, the population was 1.6 million, with a crude birth rate of 43 per 1,000. At that time, the population of Industria was growing quite slowly, because of the high death rate of 41 per 1,000. In 1875, the population began to grow very rapidly as the birth rate remained at its 1855 level, while the crude death rate dropped dramatically to 20 per 1,000. Population growth continued to increase in the small country into the late 1800’s, even though birth rates began to decline slowly.
In 1895, the crude birth rate had dropped to 37, and the death rate to 12 per 1,000. In that year (1895) a complete census revealed that the population of Industria had grown to 2.5 million. By 1950, population growth gradually began to decline as the death rate remained at its 1895 level, while the birth rate continued to decline to 22 per 1,000. In 1977, vital statistics revealed that the death rate was 10 per 1,000, and that population growth had slowed even more to an annual rate of 0.4%. By 1990, Industria had reduced its birth rate to that of its now constant, low death rate, and the population transition was completed.
A. On the axes below, plot the crude birth-rate data from 1855 to 1990. Now plot the crude death-rate data on the same axes. Clearly label the axes and the curves. (You can sketch this on a separate sheet of paper.) If you prefer, you can do the graph on the grid paper provided and upload a photo of it.
B. What was the annual growth rate of Industria in 1950? What was the birth rate in Industria in 1977?
C. Indicate TWO factors that might have accounted for the rapid decline in the death rate in Industria between 1955 and 1895. Indicate one specific reason why the birth rate might have been so high in 1855 and was so slow to decrease between 1855 and 1950.
D. Determine what the population size of Industria would have been in 1951 if the population had continued to grow at the annual rate of growth recorded for Industria in 1895. (Hint: Rule of 70.)