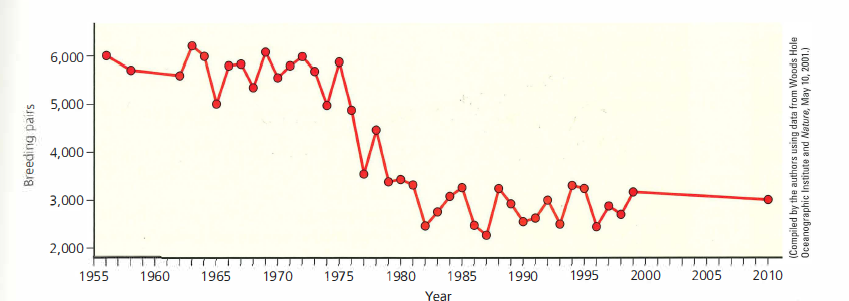
a. Assuming that the penguin population fluctuates around the carrying capacity, what was the approximate carrying capacity of the island for the penguin population from 1960 to 1975?
b. What was the approximate carrying capacity of the island for the penguin population from 1980 to 2010?
What was the percentage decline in the penguin population from 1975 to 2010?
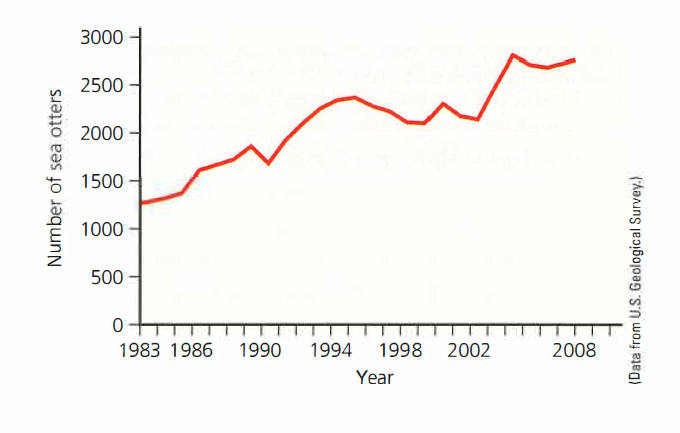
What generalized trend can be made from 1983 to 2007 from this graph?
What is the percent change in the otter population from 1995 to 2000?
Which of the following has NOT contributed to the explosion of the white-tailed deer population?

Which point on the curve above reflects the selection
most like that of an elephant, a K-selected species that
has reached its carrying capacity?
Which of the below is an example of density-dependent
population control?
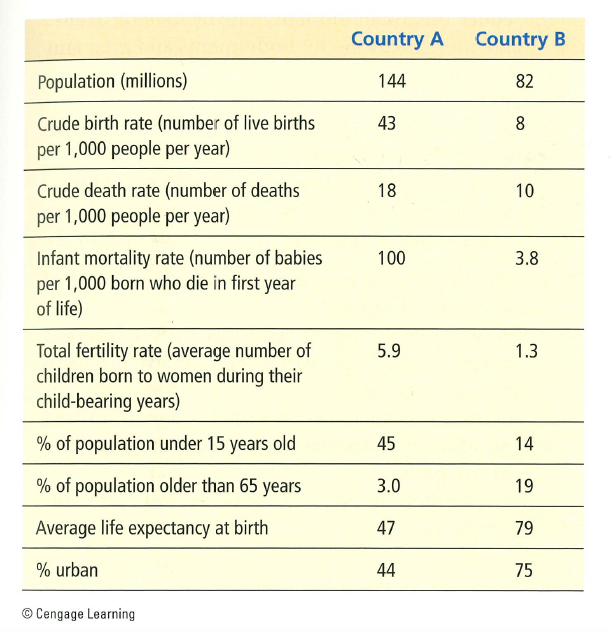
Calculate the rates of natural increase (due to births and deaths, not counting immigration) for the populations of country A and country B. Based on these calculations and the data in the table, for each of the countries, suggest whether it is a more-developed country or a less-developed country and explain the reasons for your answers.
Describe where each of the two countries may be in the stages of demographic transition. Discuss factors that could hinder either country from progressing to later stages in the demographic transition.
Explain how the percentages of people under 15 years of age in each country could affect its per capita and total ecological footprints.
A medium population growth projection calls for a population of 9.3 billion people in 2050 up from the current population of 6.7 billion. What percent increase is this?
In 1798, Thomas Malthus hypothesized the collapse of the human population. What factor proved Malthus wrong and led to the continued increases in the human population?
The infant mortality rate is NOT
Why is replacement-level fertility slightly higher than two children per couple?
Taiwan, Cuba, and most of Europe have lower infant mortality rates than the U.S., in part because of
One of the most important factors in helping to stabilize a developing country's population and reducing environmental degradation is to
Which of the below is an example of a positive use of nature's natural capital?
Which of the below is the correct order of demographic transition states that a country experiences when industrializing?
Which of the below has been utilized in both India and China to attempt to reduce population growth rates?