Natural Selection 4.1 (2/8) Exit Ticket
star
star
star
star
star
Posljednje ažuriranje about 3 years ago
5
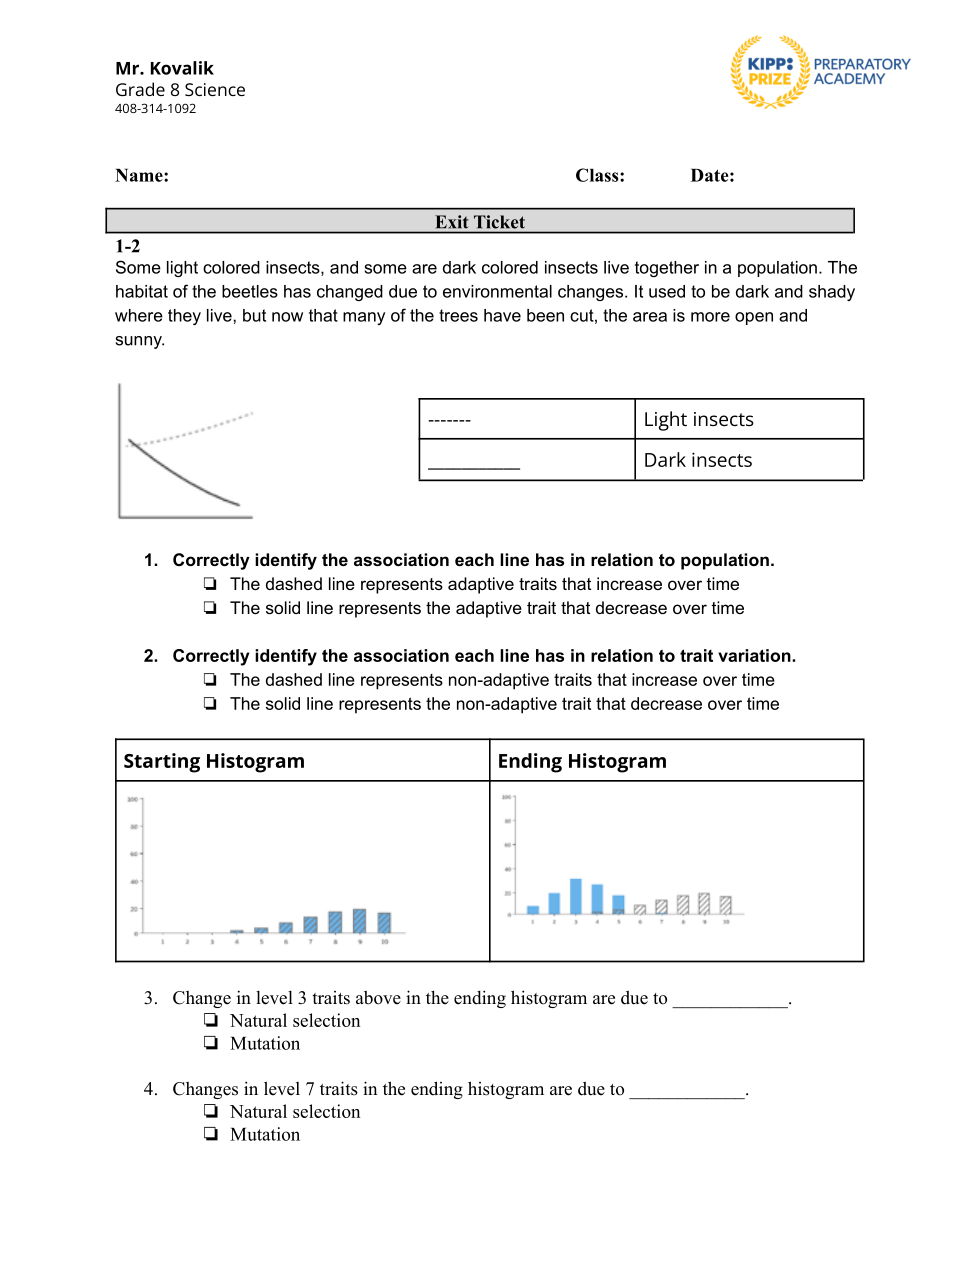
Correctly identify the association each line has in relation to population.
Explain whether the changes in level 7 traits in the ending histogram are due to natural selection or mutations.
CFS:
accurately describes the relationship between environmental changes and population variations
describes the cause and effect relationship between environmental factors and species traits
Correctly identify the association each line has in relation to trait variation.
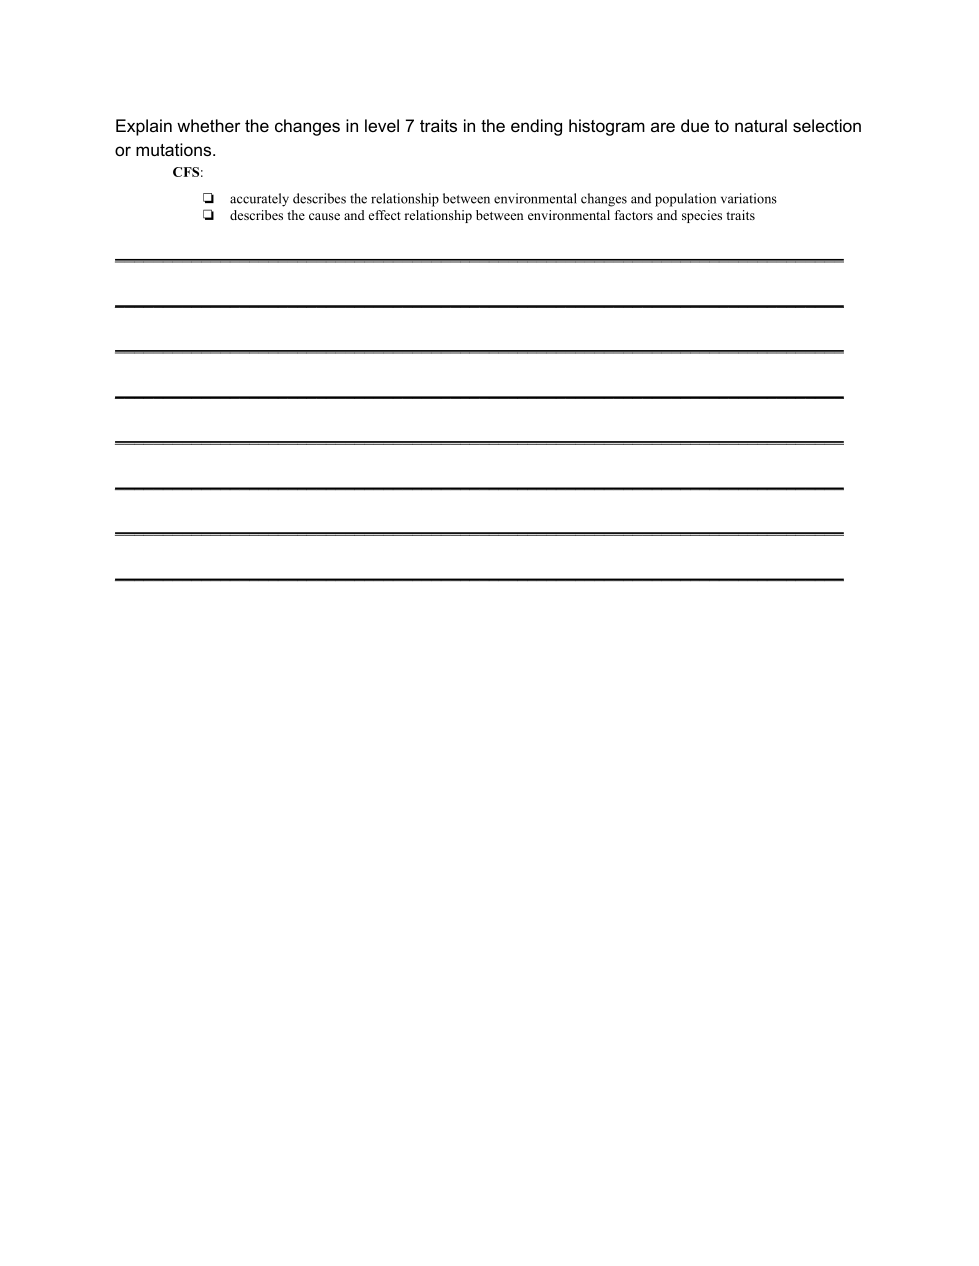
Change in level 3 traits above in the ending histogram are due to ____________.
Changes in level 7 traits in the ending histogram are due to ____________.