Log in
Sign up for FREE
arrow_back
Library
4_ Graphing motion IP
By Leslie Valdez
star
star
star
star
star
Share
share
Last updated about 4 years ago
14 questions
Add this activity
1
2
3
4
5
6
7
zoom_in
Required
7
Required
7
Required
7
Required
7
Required
7
Required
7
Required
8
8
9
10
11
12
13
14
zoom_in
Required
7
Required
8
Required
7
Required
7
Required
7
Required
7
Required
7
Question 1
1.
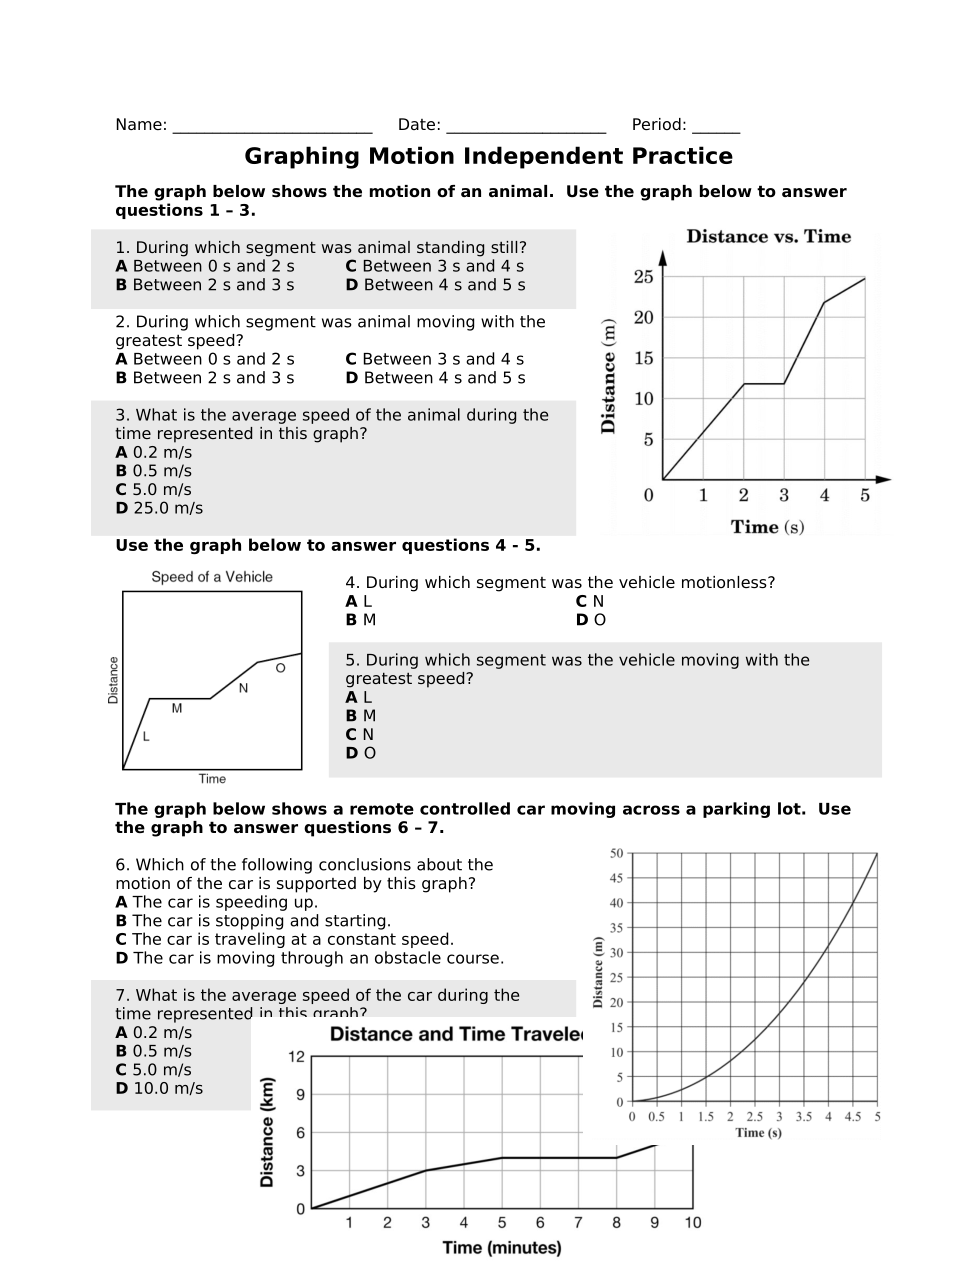
During which segment was animal standing still?
A. Between 0s and 2s
B. Between 2s and 3s
C. Between 3s and 4s
D. Between 4s and 5s
Question 2
2.
During which segment was animal moving with the greatest speed?
A. Between 0s and 2s
B. Between 2s and 3s
C. Between 3s and 4s
D. Between 4s and 5s
Question 3
3.
What is the average speed of the animal during the time represented in this graph?
A. 0.2 m/s
B. 0.5 m/s
C. 5.0 m/s
D. 25.0 m/s
Question 4
4.
During which segment was the vehicle motionless?
A. L
B. M
C. N
D. O
Question 5
5.
During which segment was the vehicle moving with the greatest speed?
A. L
B. M
C. N
D. O
Question 6
6.
Which of the following conclusions about the motion of the car is supported by this graph?
A. The car is speeding up
B. The car is stopping and starting
C. The car is traveling at a constant speed
D. The car is moving through an obstacle course
Question 7
7.
What is the average speed of the car during the time represented in this graph?
A. 0.2 m/s
B. 0.5 m/s
C. 5.0 m/s
D. 10.0 m/s
visibility
View drawing
Question 8
8.
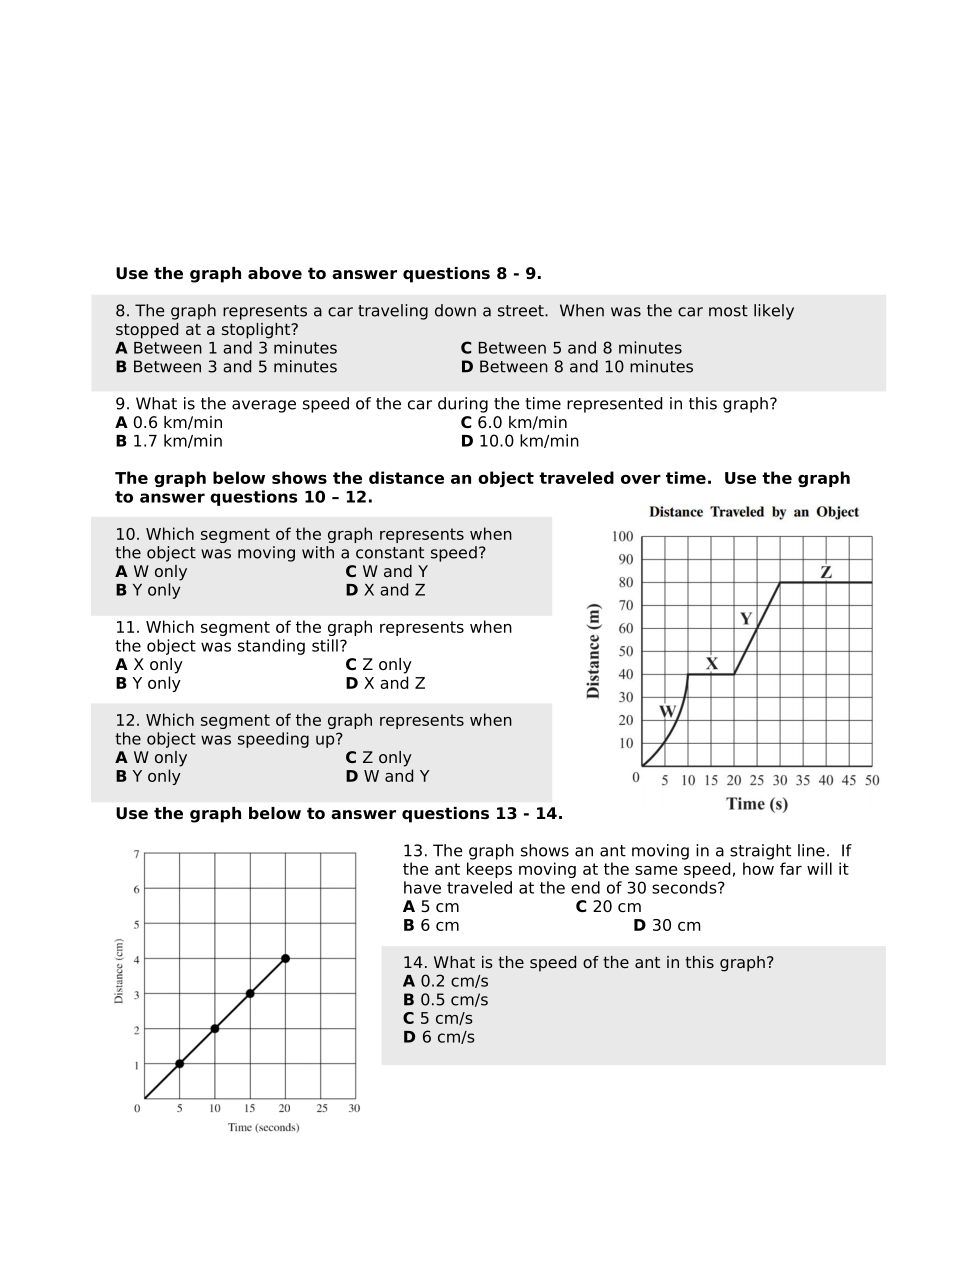
The graph represents a car traveling down a street. When was the car most likely stopped at a stoplight?
A. Between 1 & 3 minutes
B. Between 3 & 5 minutes
C. Between 5 & 8 minutes
D. Between 8 & 10 minutes
Question 9
9.
What is the average speed of the car during the time represented in this graph?
A. 0.6 km/min
B. 1.7 km/min
C. 6.0 km/min
D. 10.0 km/min
visibility
View drawing
Question 10
10.
Which segment of the graph represents when the object was moving with a constant speed?
A. W only
B. Y only
C. W & Y
D. X & Z
Question 11
11.
Which segment of the graph represents when the object was standing still?
A. X only
B. Y only
C. Z only
D. X and Z
Question 12
12.
Which segment of the graph represents when the object was speeding up?
A. W only
B. Y only
C. Z only
D. W & Y
Question 13
13.
The graph shows an ant moving in a straight line. If the ant keeps moving at the same speed, how far will it have traveled at the end of 30 seconds?
A. 5 cm
B. 6 cm
C. 20 cm
D. 30 cm
Question 14
14.
What is the speed of the ant in this graph?
A. 0.2 cm/s
B. 0.5 cm/s
C. 5 cm/s
D. 6 cm/s