Today you will begin by using what you learned about trends and fluctuations, to analyze the strongest data about gases affecting energy and our atmosphere. After comparing temperature data with how different gases have changed over time, you will create a model and explain one possible claim about the current cause of decreasing ice and increasing temperatures on Earth, to answer the Chapter 1 question: Why is the ice on Earth's surface melting?
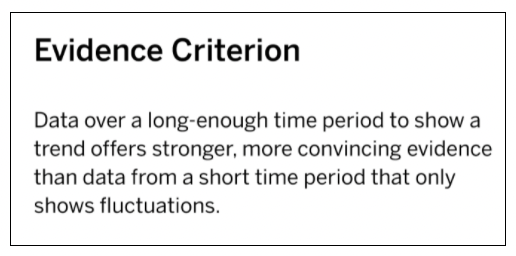
Global average temperature has increased since about 1880. Which time period's data would provide the best evidence?
Explain your answer above.
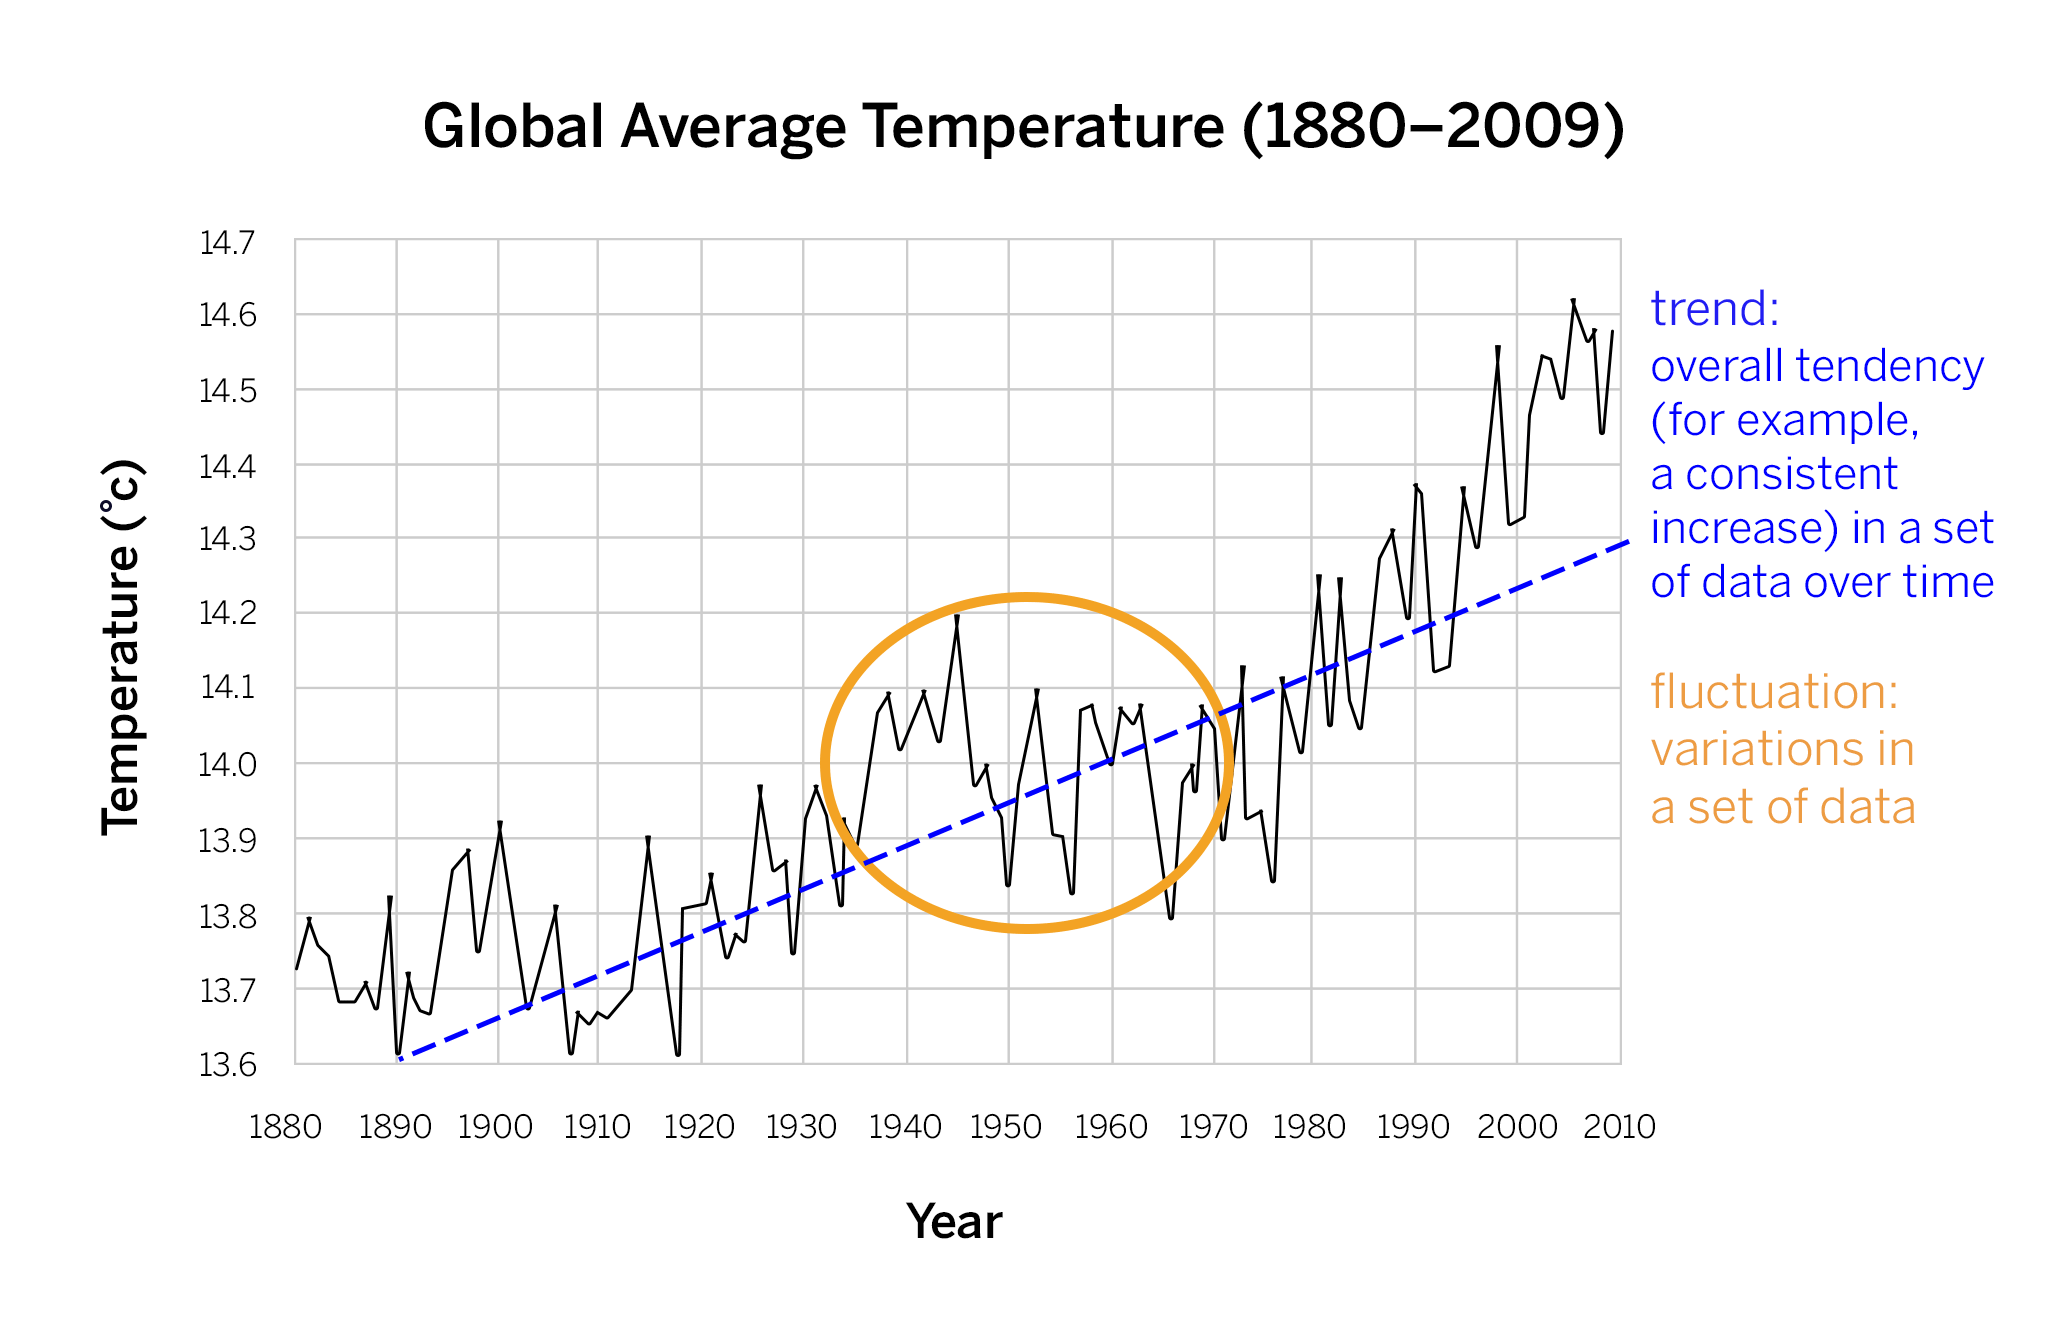
Compare the trends for carbon dioxide and temperature in the graphs below.
Do these graphs show the same trend?
Sentence Starters: These graphs (do/do not) show the same trend. I know this because...
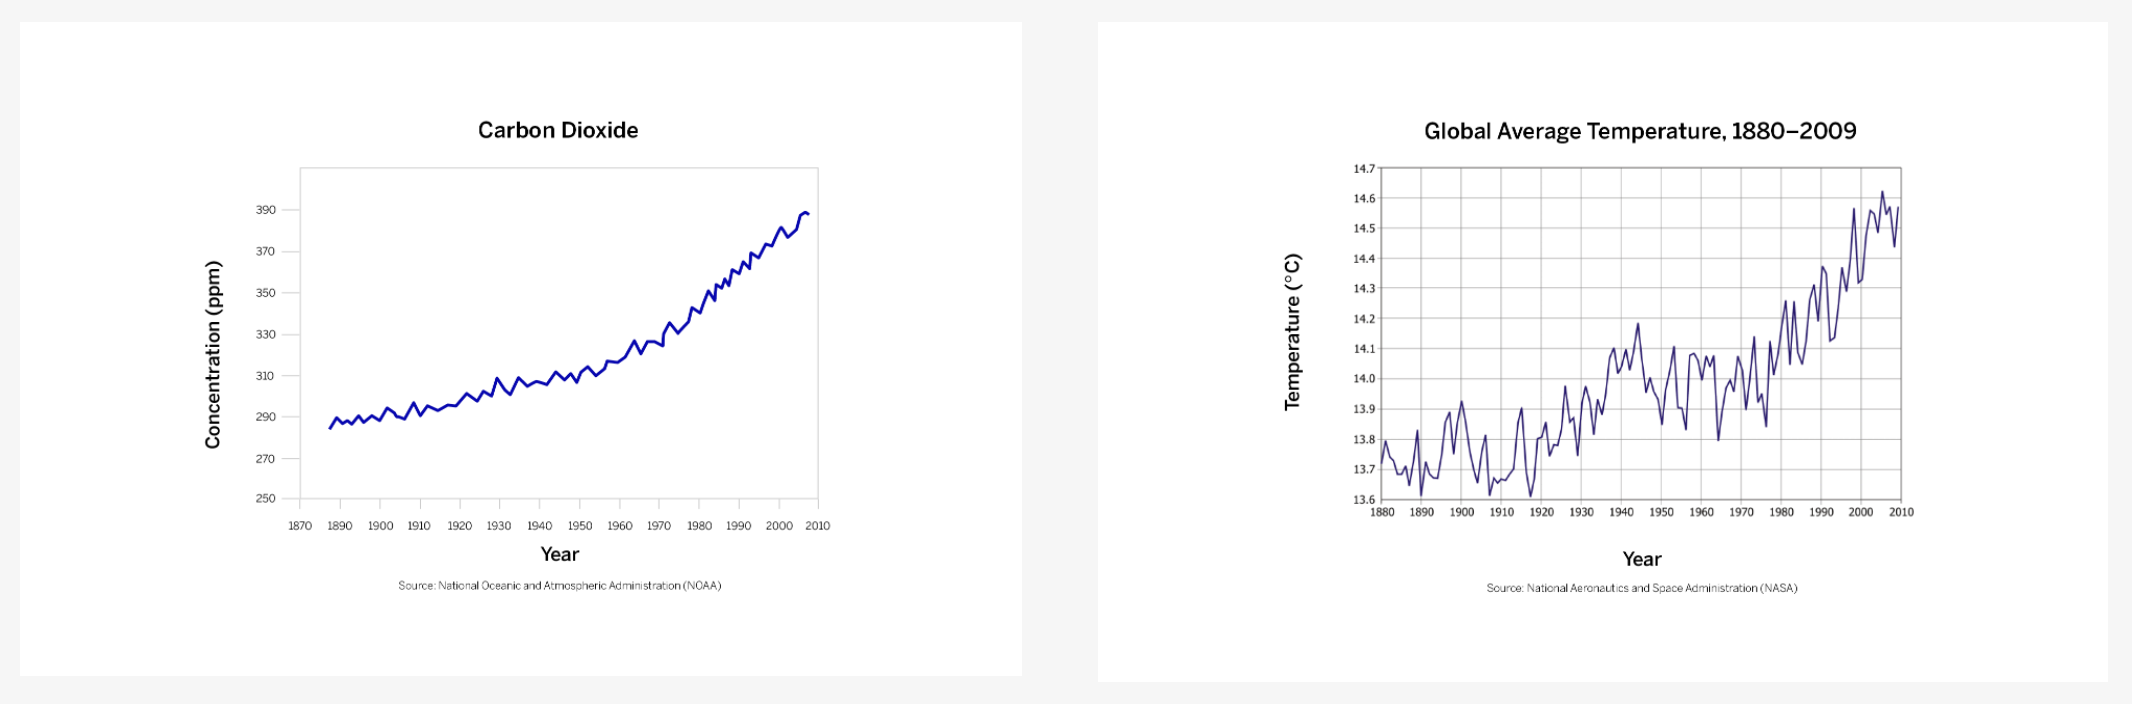
Compare the trends for methane and temperature in the graphs below.
Do these graphs show the same trend?
Sentence Starters: These graphs (do/do not) show the same trend. I know this because...
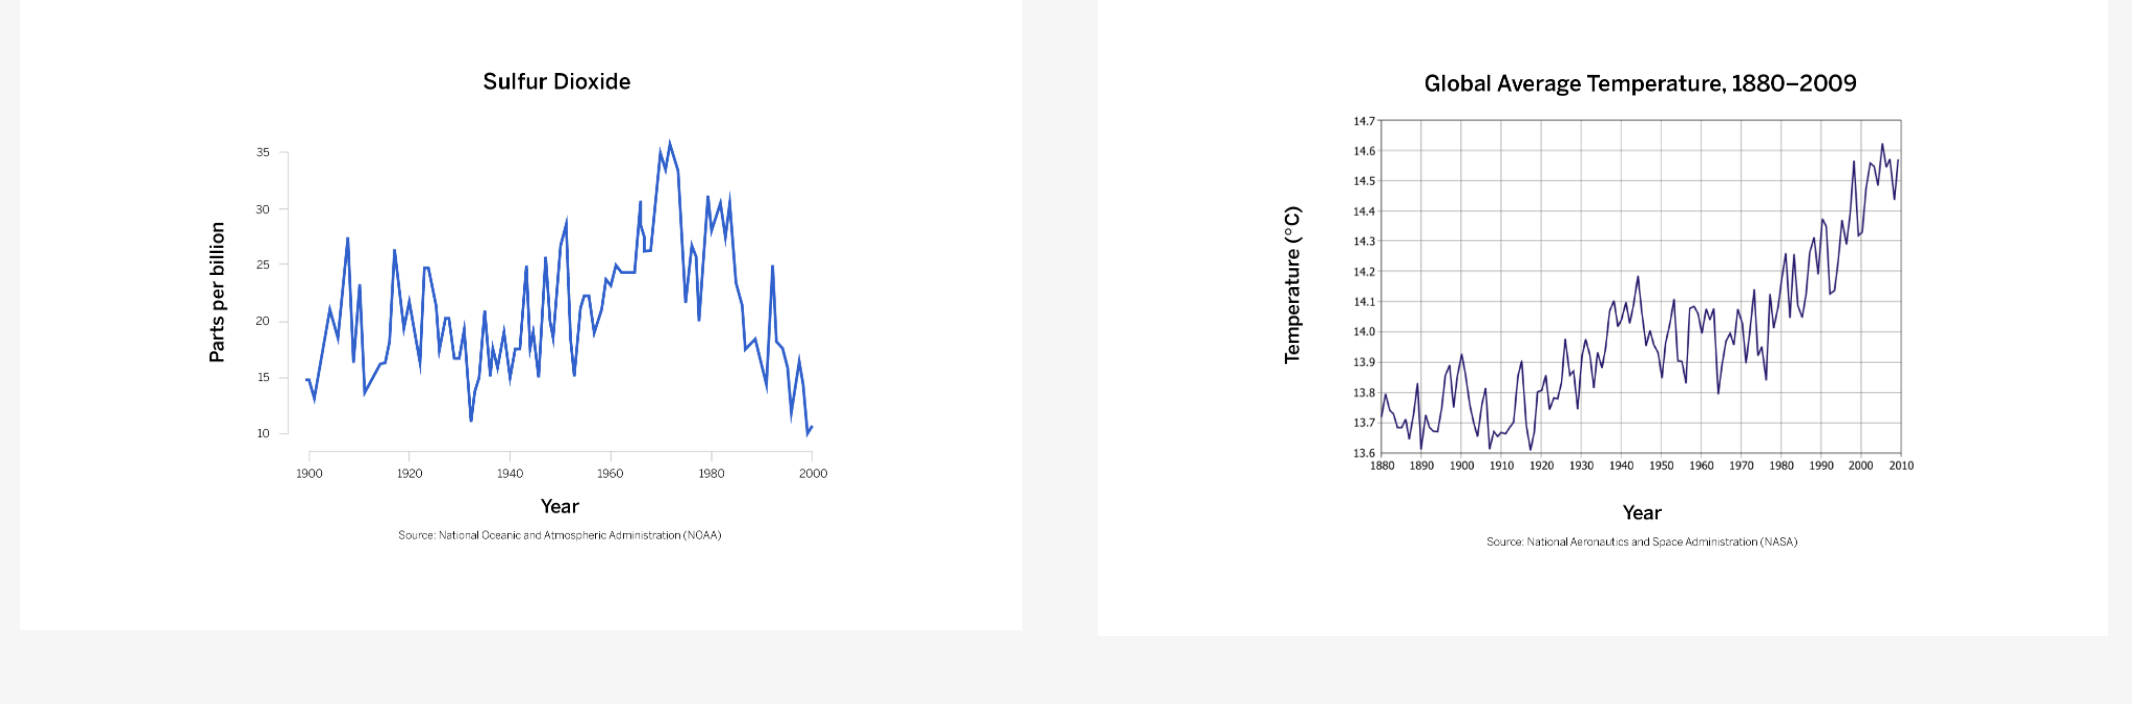
Compare the trends for sulfur dioxide and temperature in the graphs below.
Do these graphs show the same trend?
Sentence Starters: These graphs (do/do not) show the same trend. I know this because...
Which of the following claims you think might be supported by the graph evidence. (You may choose more than one.)
Part 2: Model (3 pts)
Open the Modeling Tool activity: Ice and Temperature
Read and complete all parts of the CFS for full credit on your model.
Screenshot the model and add it to Question 9.
Criteria For Success
Before Change” Model:
Add 1 gas that could change the ice and temperature (1 pt)
After Change” Model:
Add the change in the same type of gas that could cause a decrease in ice (1 pt)
Add the change in energy absorbed by Earth’s surface (1 pt).
Screenshot your Modeling Tool activity and add the image here.
Part 3: Written Response (4 pts)
Criteria for Success:
Written Criteria: 3-4 complete sentences using appropriate science vocabulary (1 pt)
Claim: Identify the gas that you modeled and how it would change over time. (1pt)
Evidence: Use evidence to explain how that gas impacts energy absorption. (1pt)
Reasoning: (1 pt)
Connect energy absorption to the temperature change and ice melting
Vocabulary: absorb, atmosphere, carbon dioxide, decrease/ increase, energy, ice, methane nitrogen dioxide, surface, sulfur dioxide, nitrogen dioxide
Sentence Starters:
One gas that causes more energy to be absorbed by Earth’s surface is…...
In the SIM…
I know because…
When you _____________ this gas…...
PROMPT: Explain how the changing the amount of certain types of gas in the Earth’s atmosphere impacts energy absorption, temperature of the Earth’s surface, and ice melting.
You may answer this prompt in writing OR make a drawing that answers the question.
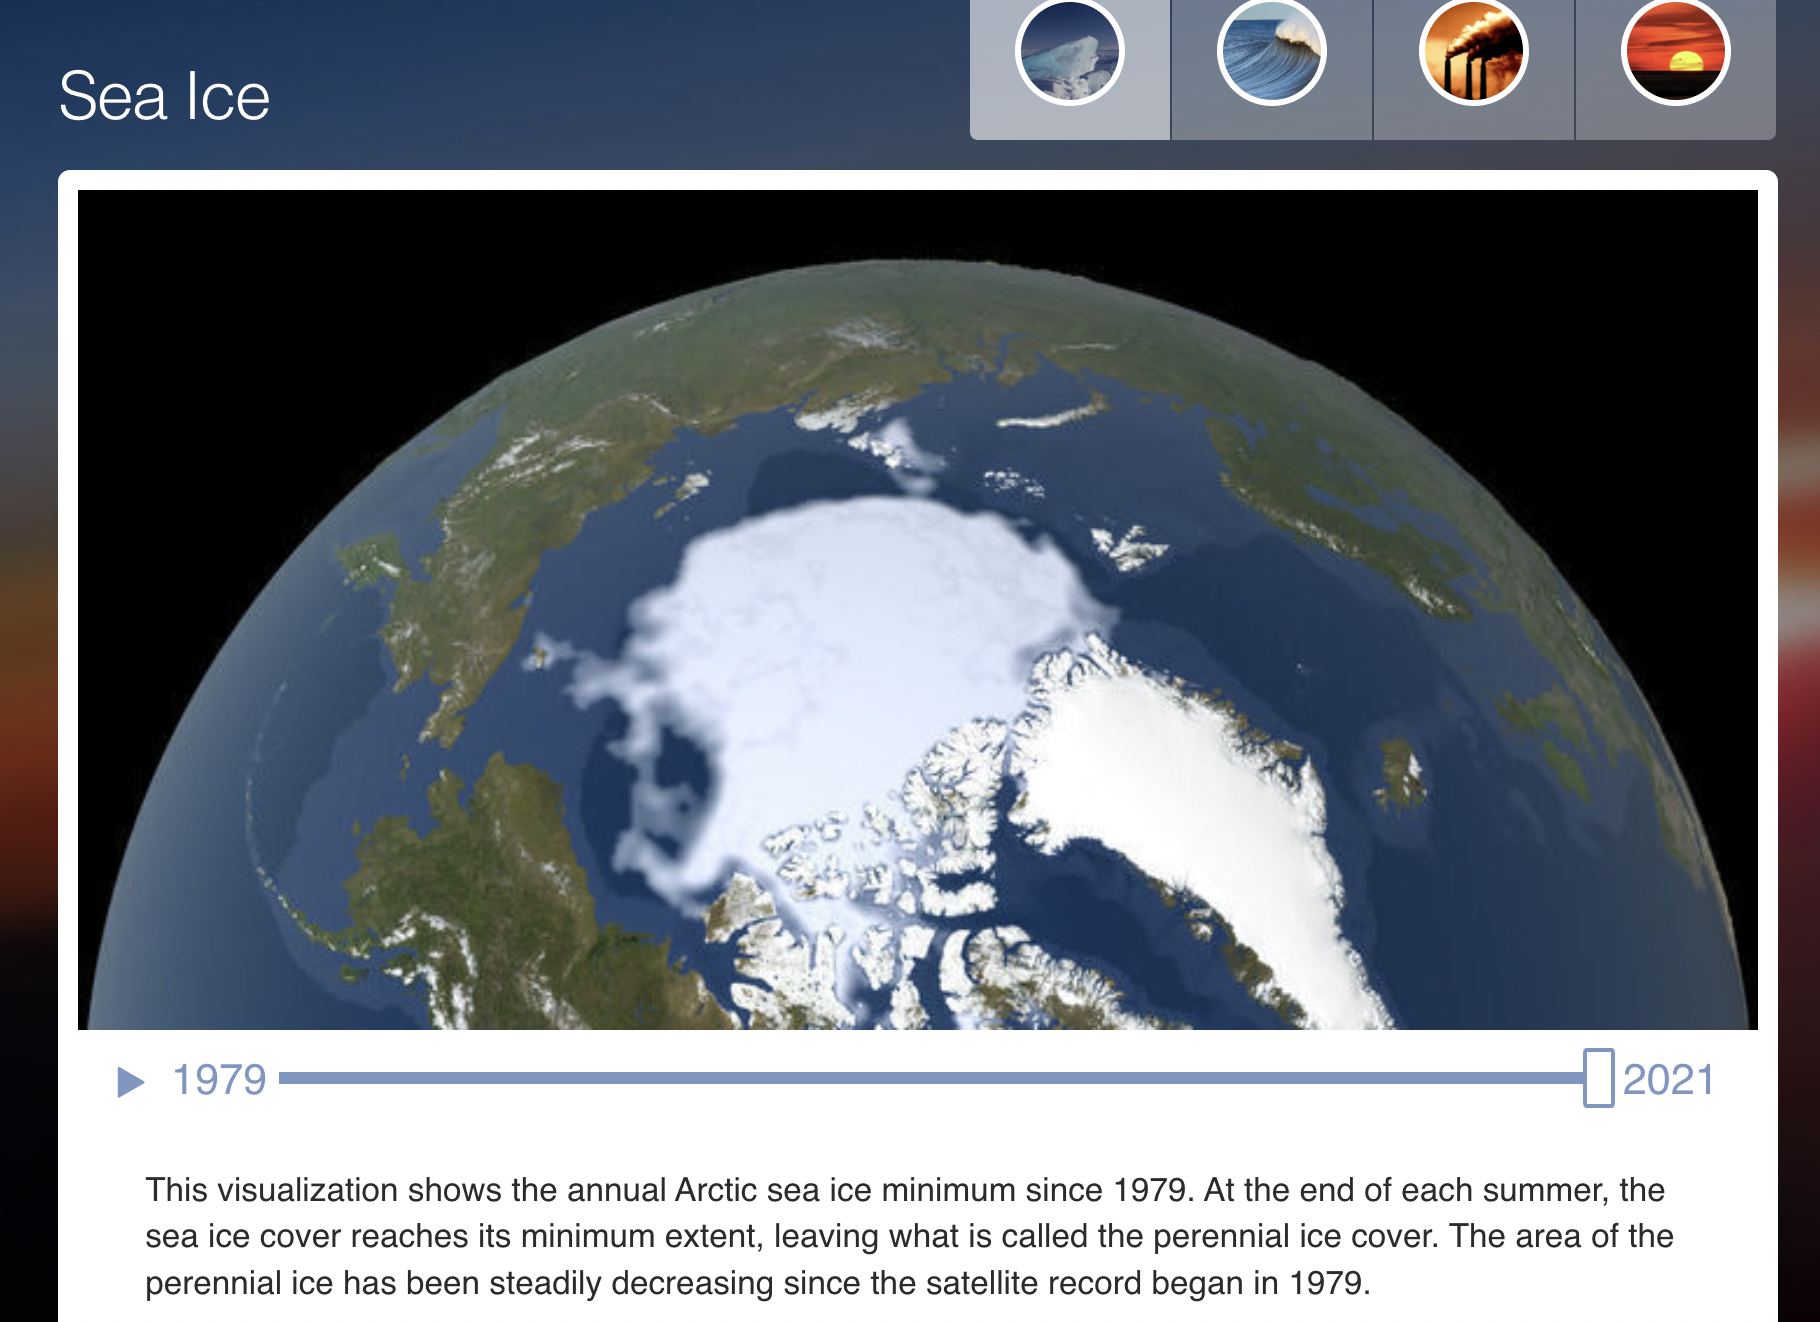
Draw a BEFORE and After image of what happened with sea ice.
Before starts from 1979 and after ends on 2021.
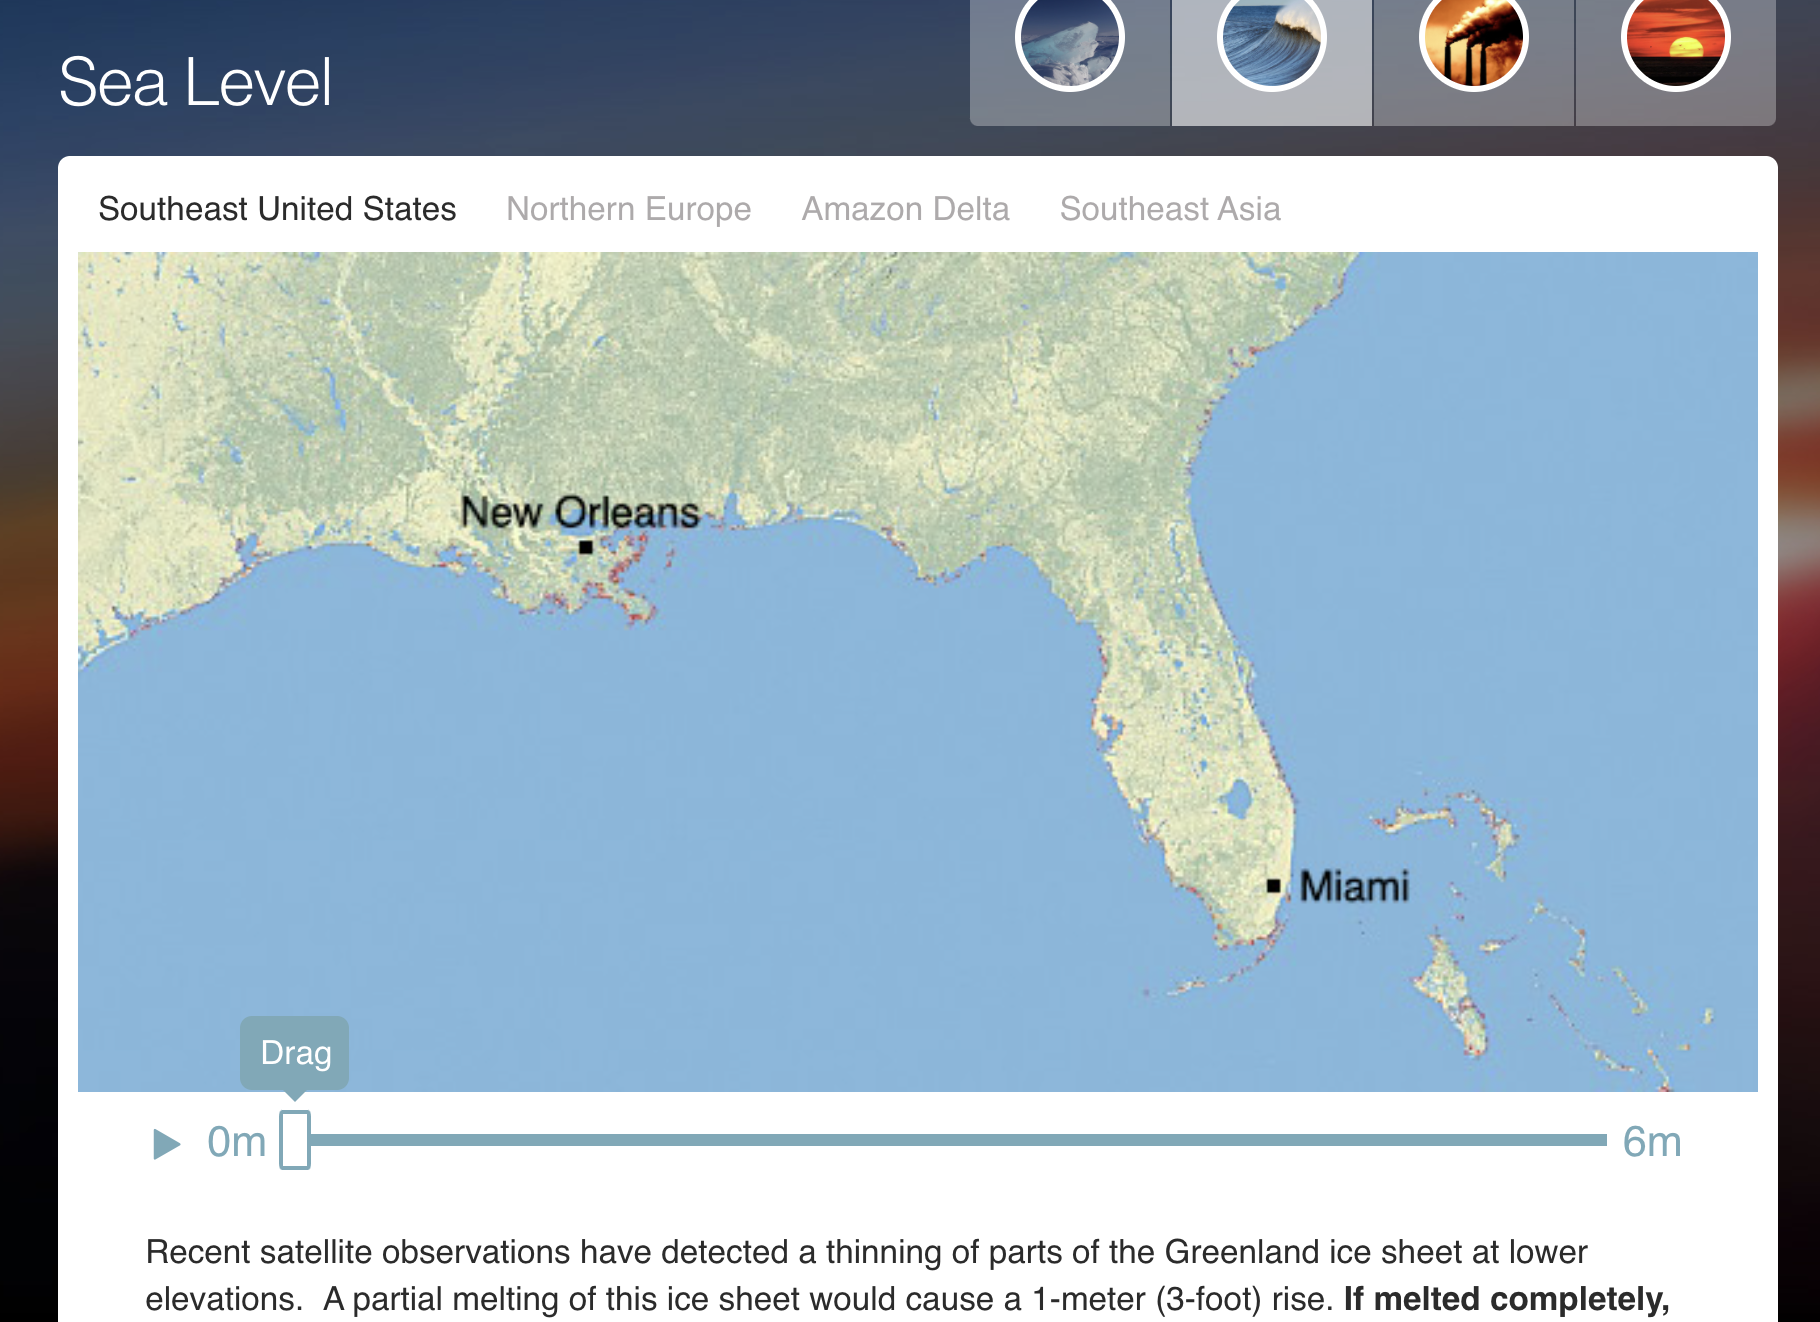
Pick one of the areas that are listed: Southeast United States, Northern Europe, Amazon Delta, Southeast Asia.
You may draw a visual of the timeline of the sea level change OR write a short summary of the changes you observed.
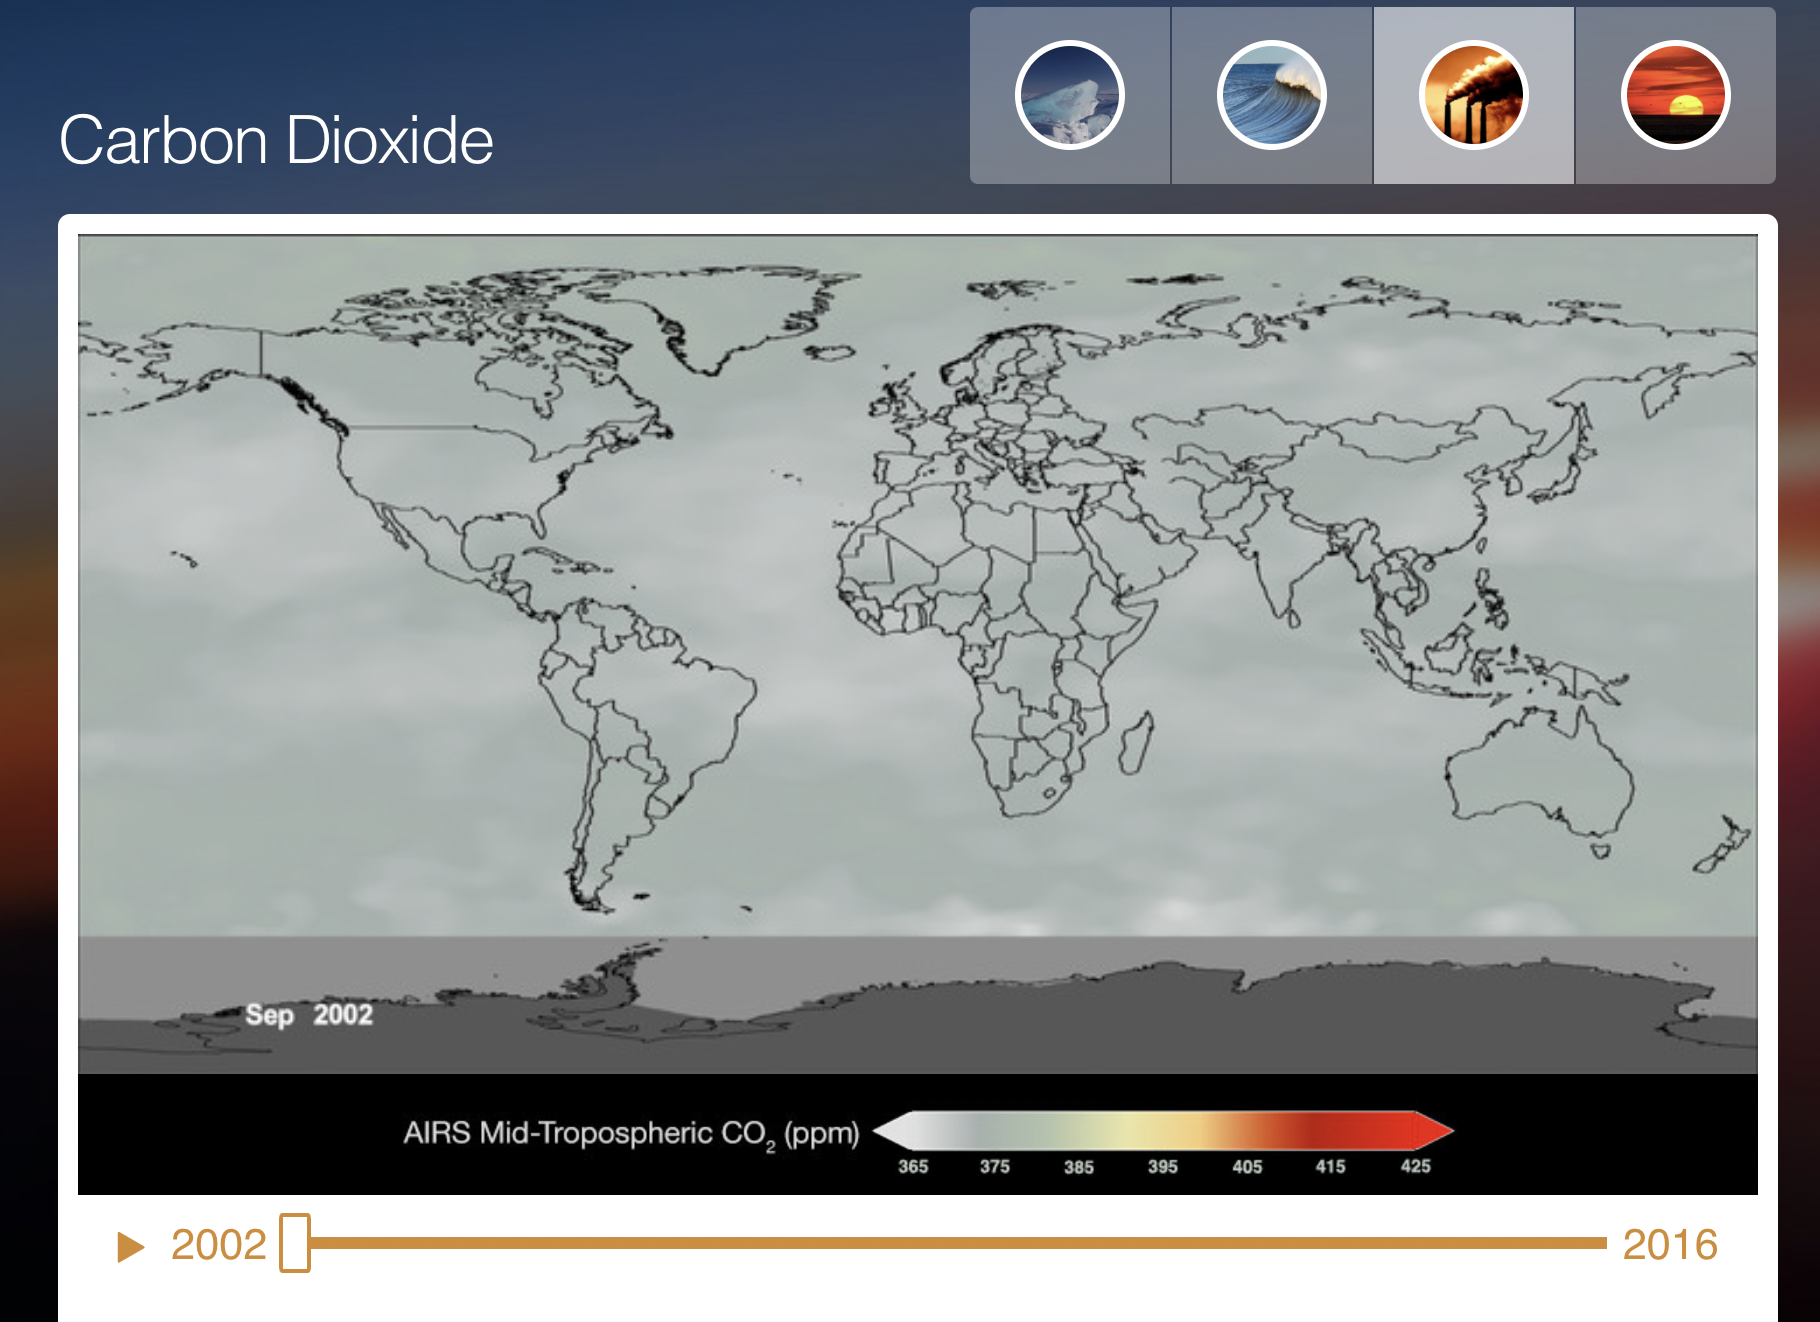
Scroll through the year 2002 to 2016.
What caused so much Carbon Dioxide to be in the atmosphere?
Draw a visual to show how much Carbon Dioxide there must be in the year 2022.
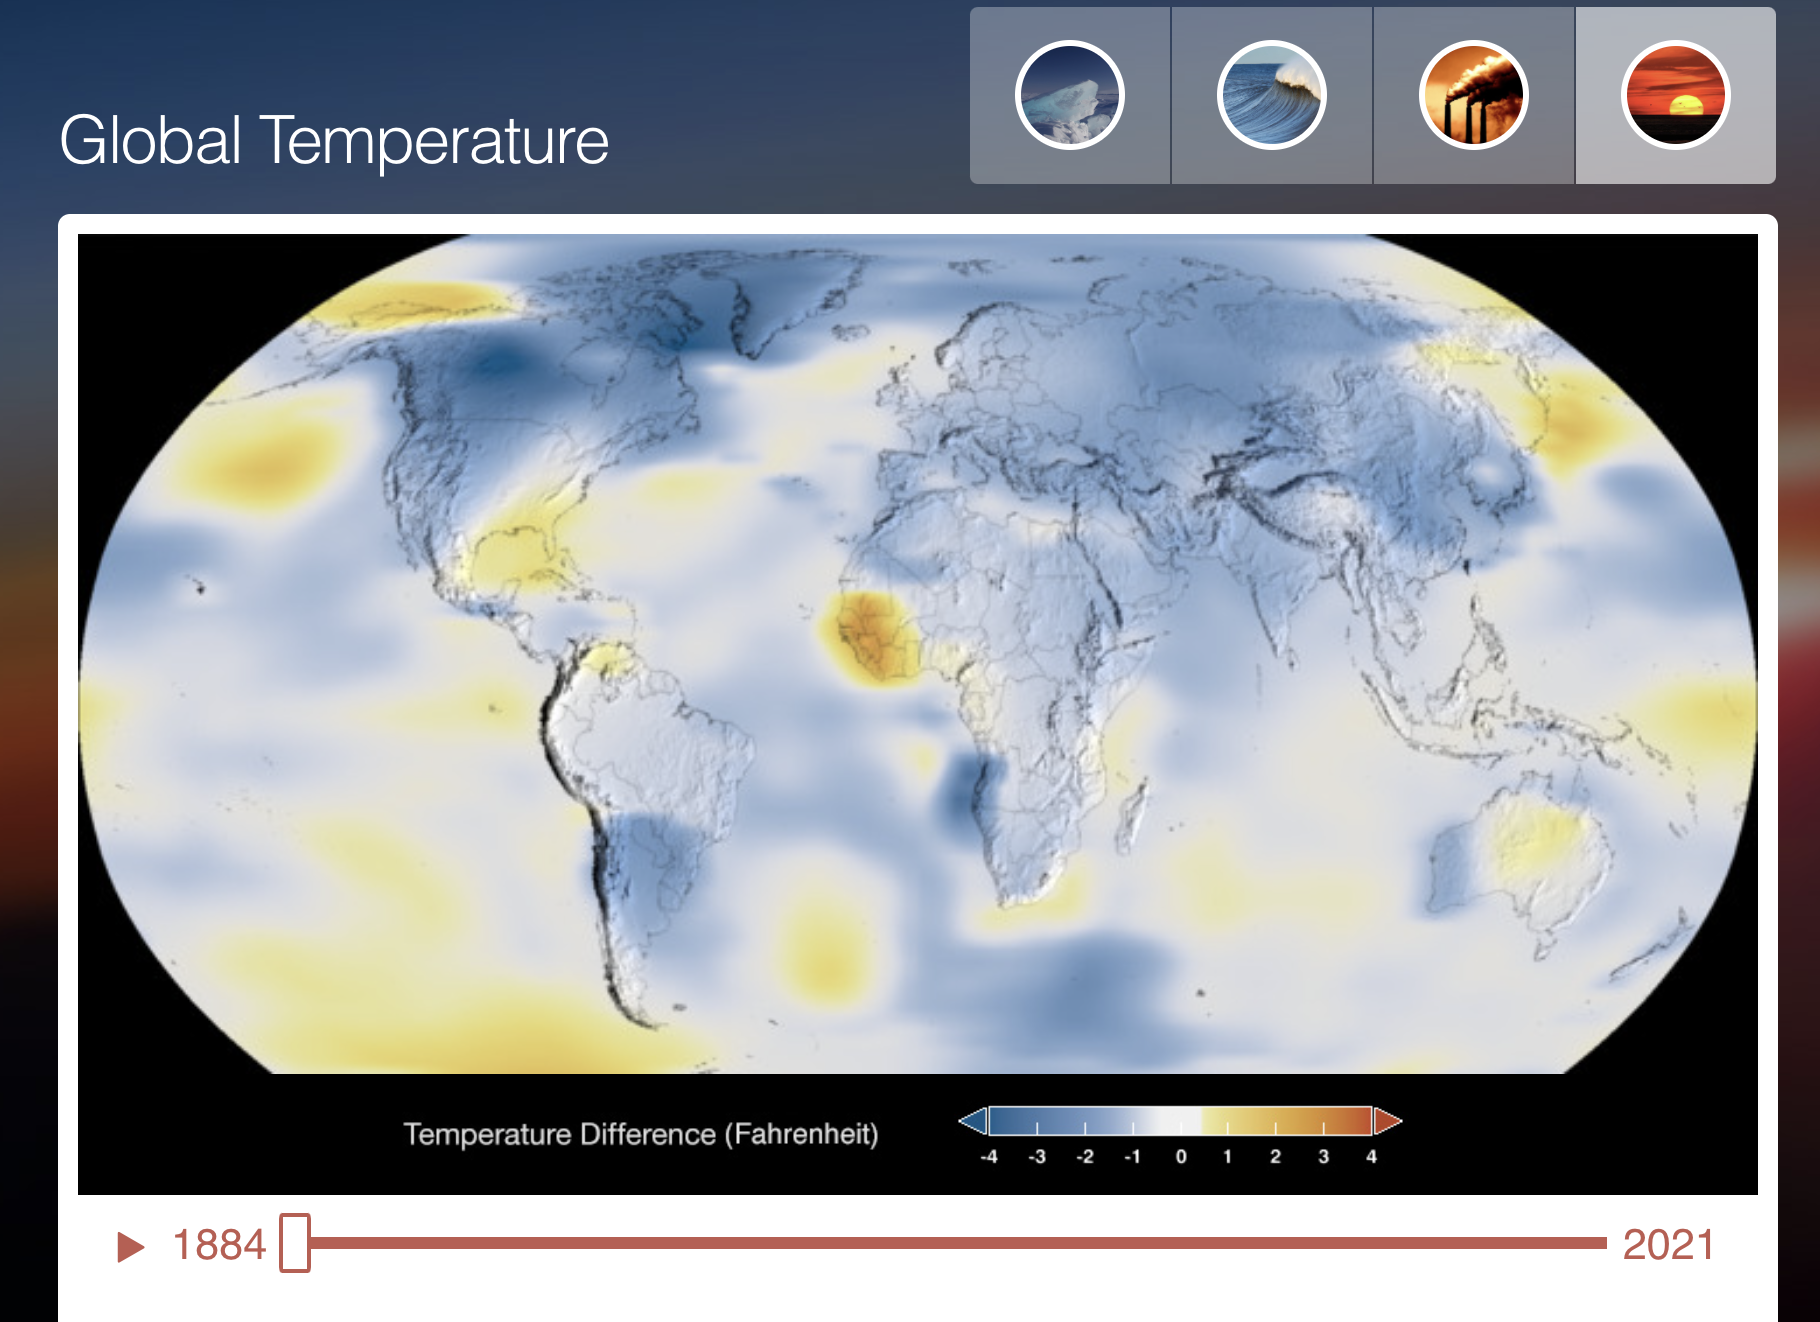
Since 1884, Global Temperatures have increased a lot.
Draw a visual of how you think the year 2100 might look like given what you already saw from the sliders.
For global average temperature, what is the trend or change?
How do you know it is that trend?