1
By how much has global temperature increased in the last hundred years?
By how much has global temperature increased in the last hundred years?
1
1
Hi kiddos, no slides are needed for this section because it's going to be heavy reading!
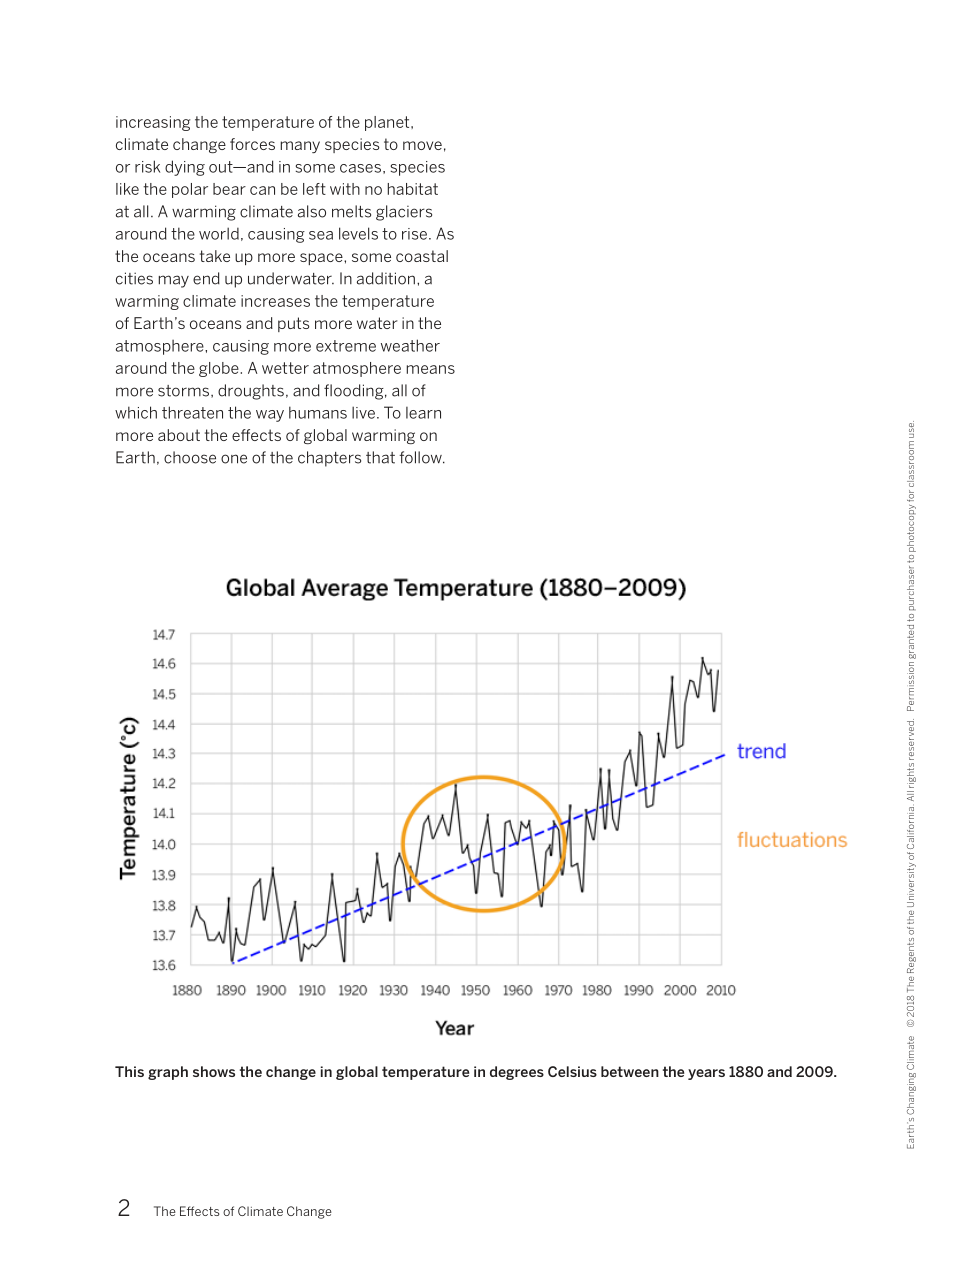
Trend = pattern
Fluctuation = data that is not stable, keeps changing, not consistent
By how much has global temperature increased in the last hundred years?
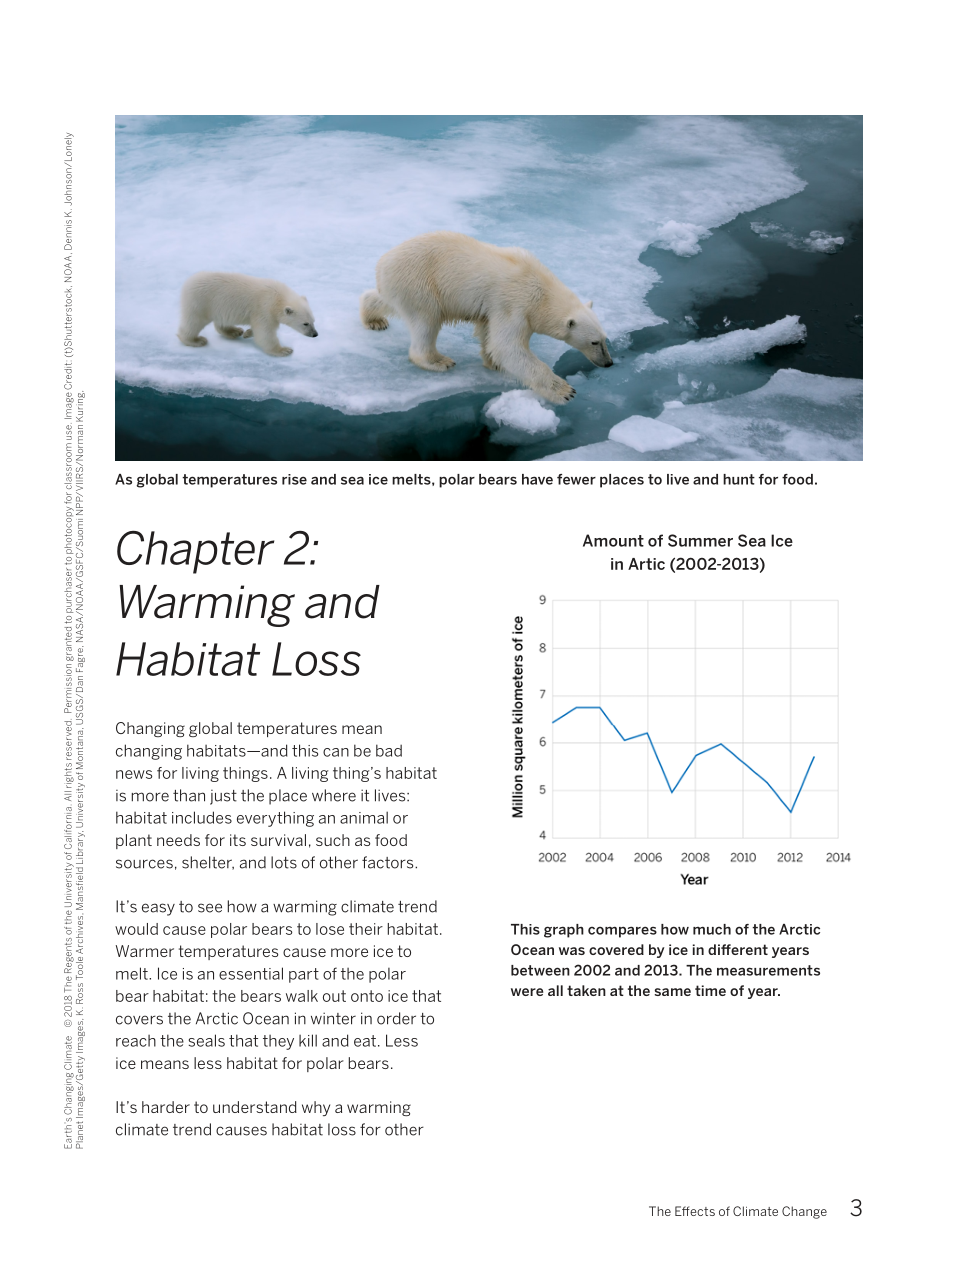
Why would Polar Bears be affected by Global Warming?
Which quote answers this question:
How does a warming climate affect weather?
Draw a visual representation of this chapter. Summarize what you learned in a drawing.
How do you think the changing global temperatures affect humans?
Fill in the blanks to this quote:
"Warmer
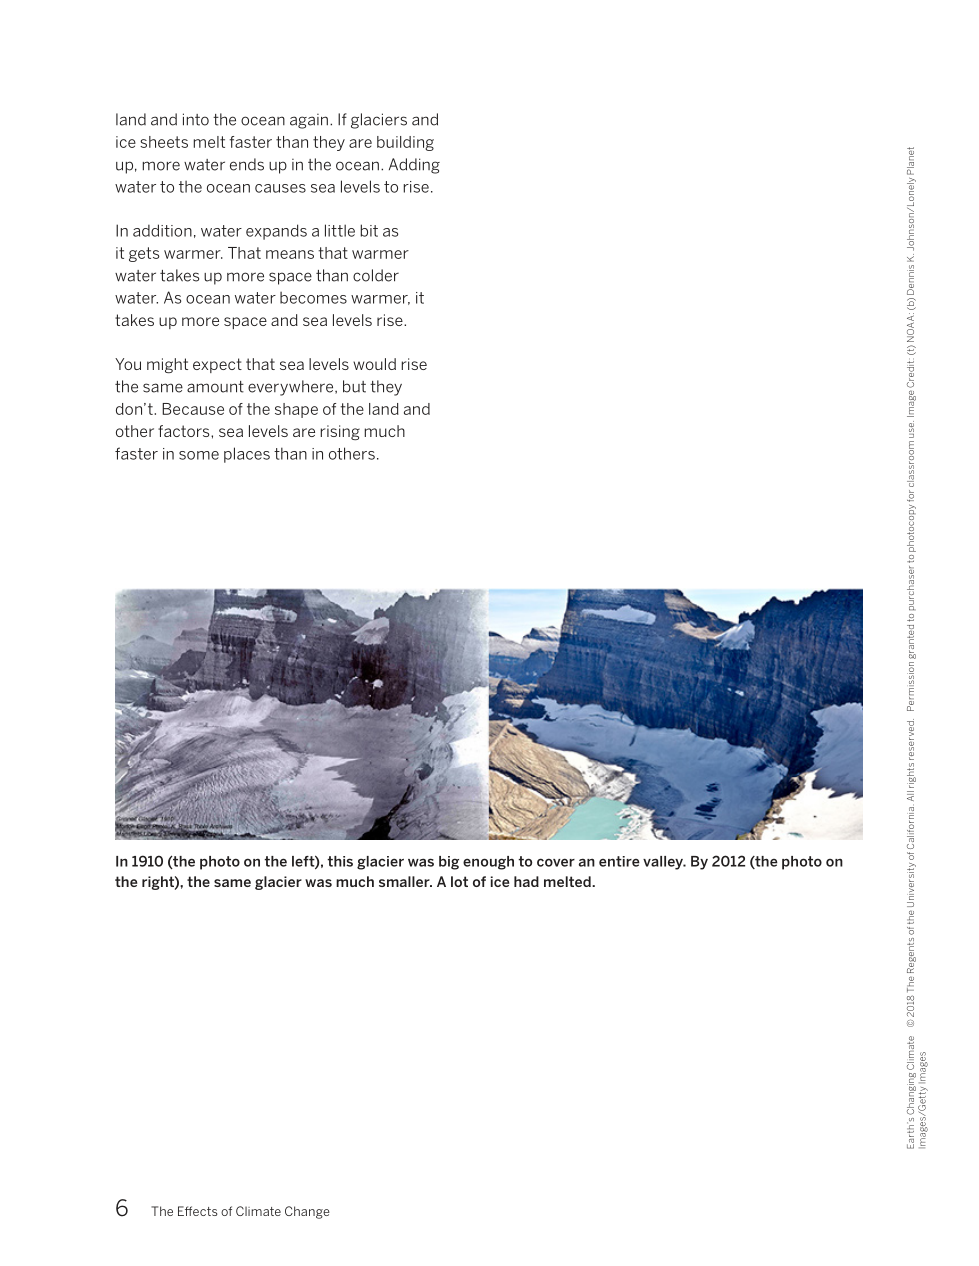
Do you think less ice has an effect on humans? How so?
Describe the trend of this graph. What has happened since 2002?
Summarize this paragraph OR draw a visual of this paragraph
Draw a visual representation of this chapter. Summarize what you learned in a drawing.
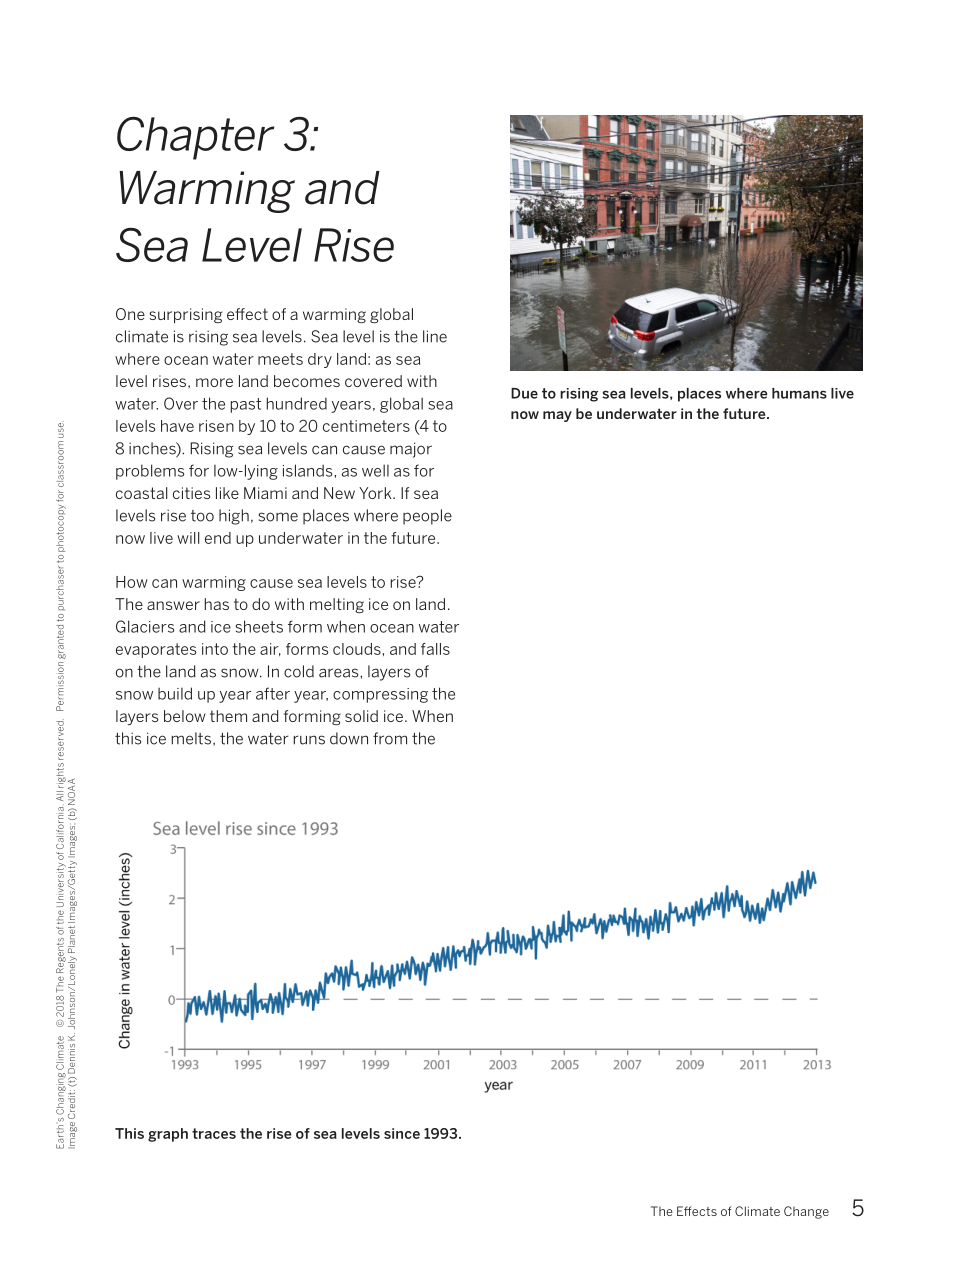
Do you think Huntington Park will be affected by rising sea levels? Why or why not?
What is "sea level"?
Why do sea levels rise faster in some areas than others?
Draw a visual representation of this chapter. Summarize what you learned in a drawing.
How can global warming lead to more extreme weather?
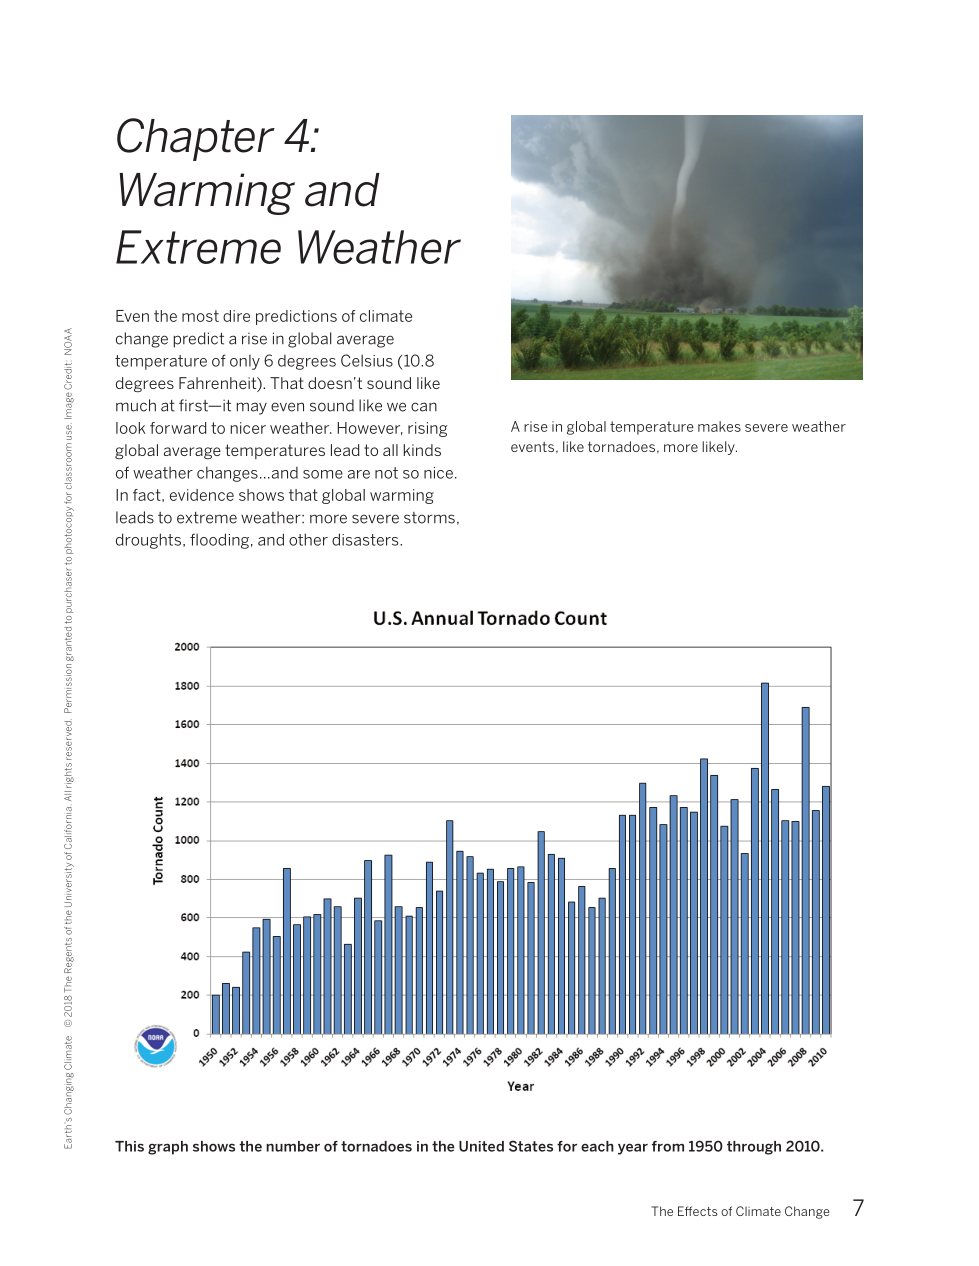
Although the graph does not show the year 2020 and on, do you think we are experiencing FEWER or MORE tornados? How do you know?
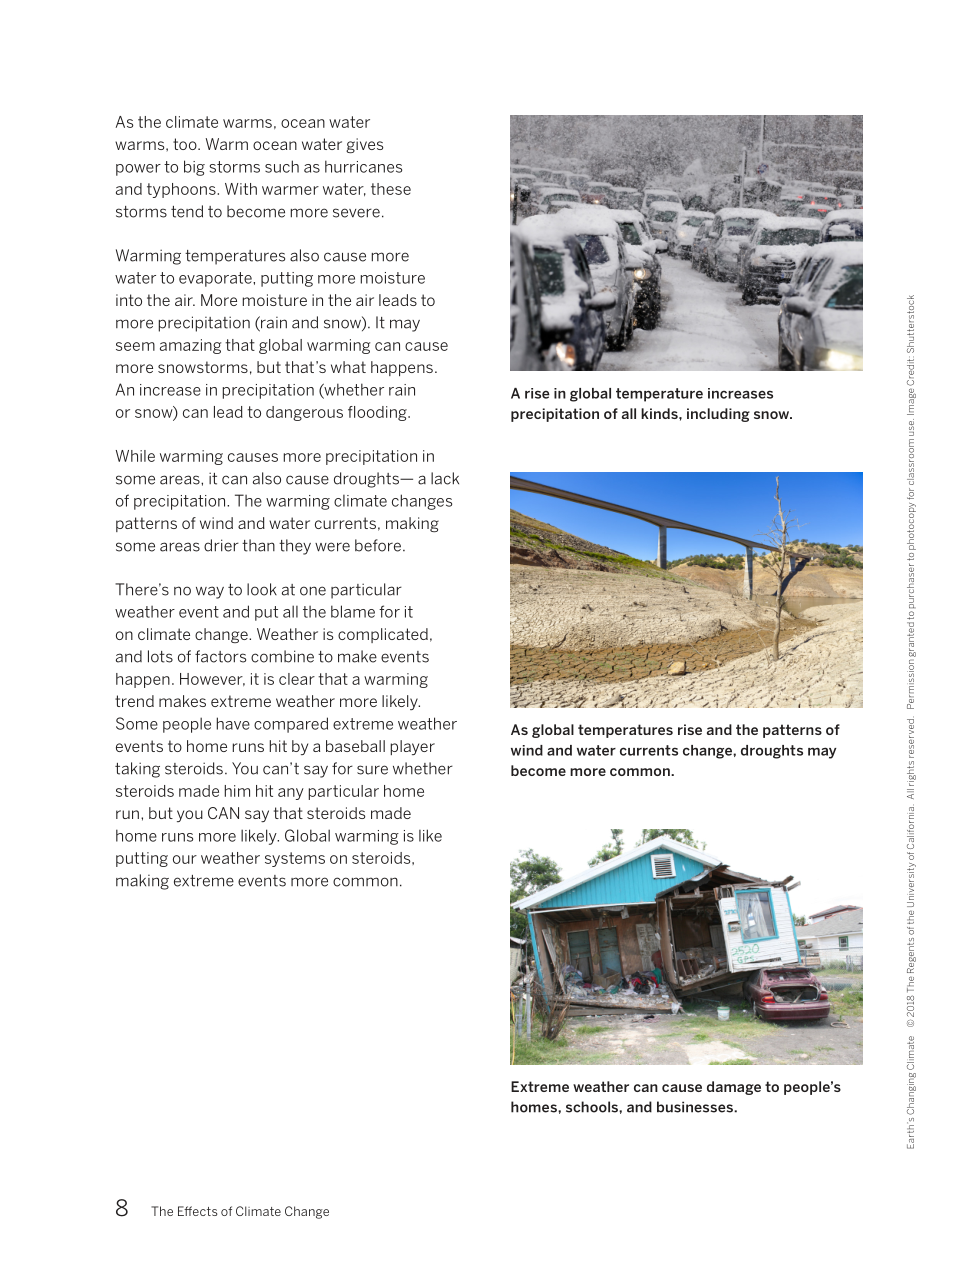
How can warming cause more precipitation (rain)?
How can more precipitation (rain) cause drought?
A warming trend makes extreme weather less likely.
Draw a visual representation of this chapter. Summarize what you learned in a drawing.
Use the website below to complete this task!
https://climate.nasa.gov/effects/#:~:text=Effects%20that%20scientists%20had%20predicted,longer%2C%20more%20intense%20heat%20waves.
After you have selected ONE of the topics, click on the button that says MORE and has a + sign. Click on that button will have a menu of more options to get more information from the website. Scroll through, read the short paragraphs, and watch the short clips.
After that, draw a visual of what you learned from the section you researched!
Try one of these:
Global Climate Change Quizzes https://climate.nasa.gov/climate_resource_center/interactives/quizzes
Images of Earth https://climate.nasa.gov/beautiful-earth/?page=0&per_page=25&order=pub_date+desc&search=&condition_1=123%3Aid%3Anoteq&category=89
Greenhouse Effect Sim https://phet.colorado.edu/sims/html/greenhouse-effect/latest/greenhouse-effect_en.html
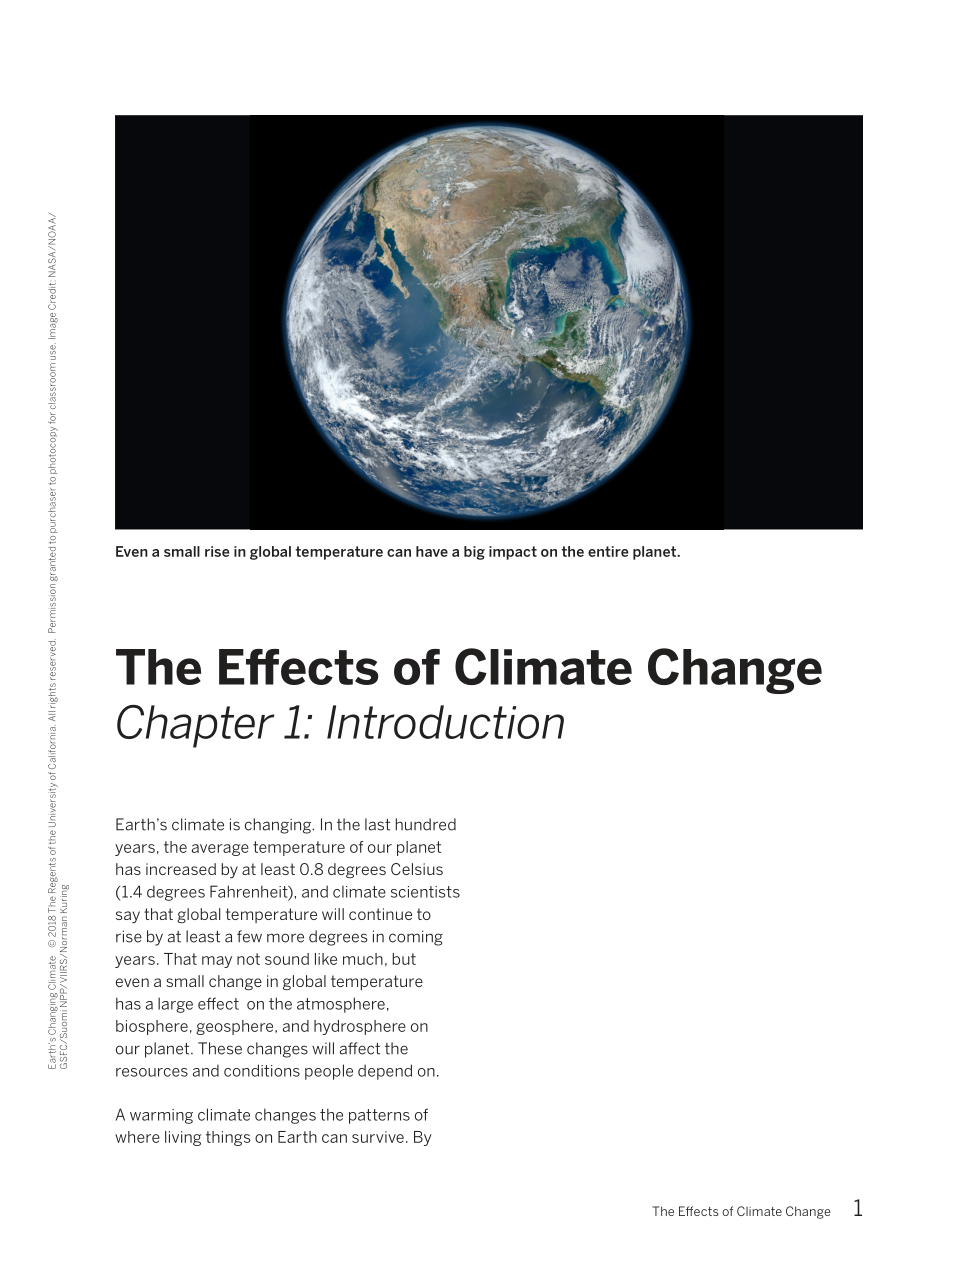
Even a small change in global temperatures has a large effect on the atmosphere.
Which spheres are affected by Global Warming? Select all that apply.
Describe the trend of this graph. What has happened since 1880?
PREDICT: Before reading the rest of the paragraph, answer the question:
How can warming cause sea levels to rise?
Describe the trend of this graph. What has happened since 1993?
Which year had the MOST tornados?
Read through the titles of each of the sections. Pick one that interests you the most.