ArcGIS Human ESRI Population Lab
star
star
star
star
star
Last updated over 4 years ago
23 Nsɛmmisa
1
1
1
1
1
1
1
1
1
1
1
1
1
1
1
1
1
1
1
1
1
1
1
The first screen shows the overall population of countries in the world. What are the three most populous countries and what are their most current population sizes? Click on the country to find the current population. Do not choose the large Europe orange circle as it shows a population of combined countries.
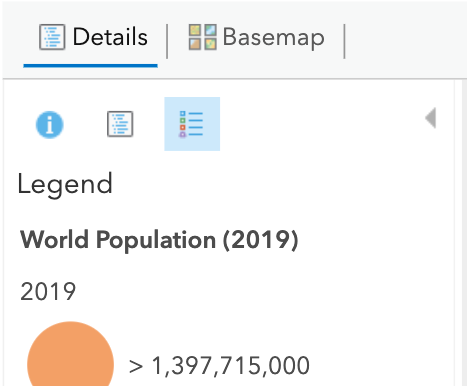
Click this button on the left-hand side. Unclick the first box and click the second box.
Which three countries have the most current highest population density? (Make sure you zoom in on the region around India)
What is the most current population density of the United States? ________________ people/square mile
Which continents have the highest infant mortality?
What is the most current infant mortality of the United States? ______________ deaths per 1000 births
Does the US have the lowest infant mortality in the world?
Hypothesize a reason why other countries have a lower infant mortality rate.
What continent has the highest total fertility rate?
Make a claim about the relationship between infant mortality and total fertility rate in many countries and justify your claim:
What reduces a country’s total fertility rate? (from your notes or book)
What is the total fertility rate for the United States? Does this seem accurate thinking about your family and friends and how many children they have? (Realize your perspective might be skewed living in a city that caters to families.)
What continent has the lowest life expectancy?
Name two other countries (other than in the continent above) with low life expectancy.
Compare the life expectancy of the United States with Europe and Canada. Hypothesize a reason for this difference.
What regions/countries of the world are shrinking in population?
What challenges do these countries (from previous question) face in the upcoming years?
What regions of the world are rapidly increasing in population?
What challenges do these countries face in the upcoming years? (From your notes or book)
Make a claim about the relationship (pattern) between life expectancy and natural increase rate:
Choose a country in the middle of Africa with a high natural increase rate. Is the rate increasing or decreasing over the past 50 years?
Click on a country with declining growth, one with slow growth and one with higher growth. Name the country and sketch its graph or “snip” and paste the graph.
Use the rule of 70 to determine the doubling time of 4 countries with positive growth.
70/growth rate = years to double.
Example: Canada has a growth rate of 0.6%.
70/.6 = 117 years to double
Choose three different countries (than the ones you chose above) and click on its current population pyramid. Click the word “Current” after you click on a country. Snip and paste its population pyramid below or sketch.
Think about the following:
On an exam, could you pick out the pyramid of a fast growing, steady, or shrinking population?
Can you pick out a pyramid of a country that has high levels of education for women?
Can you pick out a pyramid of a country that may run out of community resources soon?
Can you pick out a pyramid of a country with a low TFR (total fertility rate)? A high TFR?
