

3. Draw a diagram to represent each of these situations. Then write an addition expression that represents the final temperature.
c) The temperature was -5 deg F and then fel 8 deg F.
4. Decide whether each table could represent a proportional relationship. If the relationship could be proportional, what would be the constant of proportionality?
*Fill in the table below.
4. Decide whether each table could represent a proportional relationship. If the relationship could be proportional, what would be the constant of proportionality?
*Fill in the table below.
5. Noah was assigned to make 64 cookies for the bake sale. He made 125% of that number. 90% of the cookies he made were sold. How many of Noah's cookies were left after the bake sale?
Show your work.

Exit Ticket
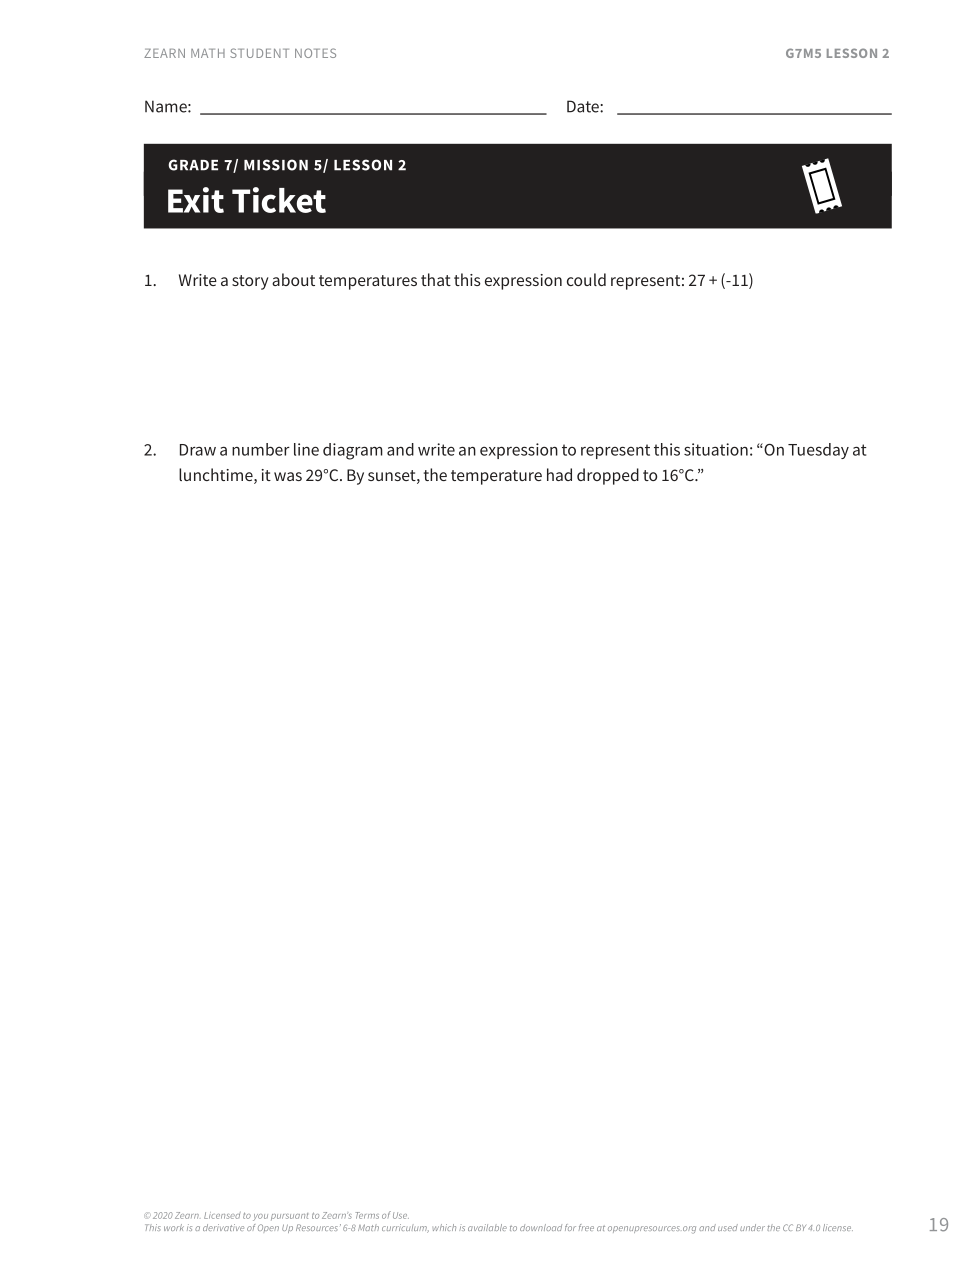
1. Write a story about temperatures that this expression could represent: 27 + (-11)
Exit Ticket
2. Draw a number line diagram and write an expression to represent this situation: "On Tuesday at lunchtime, it was 29 deg C. By sunset, the temperature had dropped to 16 deg C."
1a. The temperature is -2 degrees C. If the temperature rises by 15 degrees C, what is the new temperture?
1b. At midnight the temperature is -6 degrees C. At midday the temperature is 9 degrees C. By how much did the temperature rise?
2. Complete each statement with a number that makes the statement true.
a) _____< 7degrees C
2. Complete each statement with a number that makes the statement true.
b) _____< -3 degrees C
2. Complete each statement with a number that makes the statement true.
c) -0.8 deg C< _____< -0.1 deg C
2. Complete each statement with a number that makes the statement true.
d) _____< -2 deg C
3. Draw a diagram to represent each of these situations. Then write an addition expression that represents the final temperature.
a) The temperature was 80 deg F and then fell 20 deg F.
3. Draw a diagram to represent each of these situations. Then write an addition expression that represents the final temperature.
b) The temperature was -13 deg F and then rose 9 deg F.