Log in
Sign up for FREE
arrow_back
Library

[BBI] Supply & Demand Formative Assessment

star
star
star
star
star
Last updated over 2 years ago
15 questions
Required
1
SSEMI2.b
Required
1
SSEMI2.a
Required
1
SSEMI2.b
SSEMI2.f
Required
1
SSEMI2.f
Required
1
SSEMI2.f
Required
1
SSEMI2.a
Required
1
SSEMI2.e
Required
1
SSEMI2.b
Required
1
Required
1
Required
1
Required
1
Required
1
Required
1
Required
1
Question 1
1.

Question 2
2.

Question 3
3.

Question 4
4.

Question 5
5.

Question 6
6.

Question 7
7.

Question 8
8.

Question 9
9.

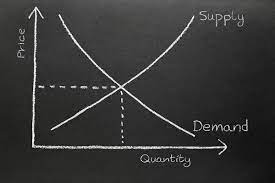
Identify the spot that represents the market equilibrium on the following image.

Question 10
10.

Select all of the spots that are part of the demand curve on the following image.

Question 11
11.

Select all of the spots that are part of the supply curve on the following image.

Question 12
12.
All else being equal, demand goes _______ when prices come down.
Question 13
13.
All else being equal, supply comes down when prices come _______ .
Question 14
14.
The "Demand" part of the Economic Principle of Suppy and Demand is from the _______ 's perspective.
Question 15
15.

Which of the following is represented by the arrows in the graph below?
decrease in demand
increase in demand
decrease in quantity demanded
increase in quantity demanded
Which of the following is the best example of the law of demand?
a consumer purchases more shoes when they find a style they really like
a consumer purchases more shoes when they go on a "buy-one-get-one" sale
a consumer buys more shoes when the price increases
a consumer purchases more shoes when his income rises
The expectation of a sale on a good/service in the future is most likely to lead to which of the following right now?
market equilibrium
decrease in demand
increase in demand
Which of the following would likely cause the shift (illustrated by the arrow) shown below in the market for avocados?
Canadian incomes fall for the third month in a row.
New research shows that avocados are good for heart health.
Avocado-growing regions experienced a severe drought and crop disease.
New fertilizer leads to large avocado crop.
Assume that chips and salsa are COMPLEMENTARY goods, meaning they are used together. How will the market for chips be affected if the price of salsa DECREASES to $1 per bottle?
Demand for chips will increase.
Demand for chips will decrease.
Demand for chips will be unchanged.
Supply of chips will increase.
Which of following is the best example of the Law of Supply?
a producer supplies a greater quantity of products as the price increases.
a consumer buys fewer products as price increases.
a consumer buys less products as the price decreases.
Which of the following news headlines would cause the shift shown on the graph below (as illustrated by the arrows) in the market for cars?
Steel, a resource used in making cars, doubles in price
Canadian incomes rise.
More mass transit replaces the need for personal vehicles.
New technology makes car production more efficient.
The movement from P1, Q1 to P2, Q2 (as illustrated by the arrow) in the image below is best described as
an increase in quantity supplied
an increase in supply
a decrease in supply
a decrease in quantity supplied
Match the examples in the left column with the correct category in the right column.
Desktop computer and laptop
winter coat and winter boots
Nike running shoes and Reebox running shoes
apple and orange
complementary goods
substitute goods