For your reference, for the question below:
For your reference, for the question below:
Complete the Graph that Motion Practice.
https://www.physicsclassroom.com/Physics-Interactives/1-D-Kinematics/Graph-That-Motion/Graph-That-Motion-Interactive
Ⓐttach a screenshot showing the total amount of stars you achieved.
How does the position graph differ if one is walking slowly vs. quickly?
How does the position graph differ if one is walking towards the motion detector vs. away from it?
H̸o̸w̸ ̸d̸o̸e̸s̸ ̸t̸h̸e̸ ̸p̸o̸s̸i̸t̸i̸o̸n̸ ̸g̸r̸a̸p̸h̸ ̸d̸i̸f̸f̸e̸r̸ ̸i̸f̸ ̸o̸n̸e̸ ̸i̸s̸ ̸w̸a̸l̸k̸i̸n̸g̸ ̸s̸l̸o̸w̸l̸y̸ ̸v̸s̸.̸ ̸q̸u̸i̸c̸k̸l̸y̸?̸ What does your answer look like if Mr. Lynch accidentally adds a question 2x?
What does the position graph look like if an object is standing still?
What does the position graph look like if an object is moving at constant speed?
What does the position graph look like if an object is getting faster or slower?
How does the velocity graph differ if one is walking slowly vs. quickly?
How does the velocity graph differ if one is walking towards the motion detector vs. away from it?
What does the velocity graph look like if an object is standing still?
What does the velocity graph look like if an object is moving at constant speed?
What does the velocity graph look like if an object is getting faster or slower?
https://www.gigaphysics.com/graphs_lab.html
Select Position vs. Time #1
Take a screenshot of your position/time graph and attach it.
What did the caterpillar have to do when the graph changed from an upward slope to downward?
What did the caterpillar have to do for the graph to return to the horizontal axis at the end?
https://www.gigaphysics.com/graphs_lab.html
Select Position vs. Time #2
Take a screenshot of your position/time graph and attach it.
What did the caterpillar have to do during the horizontal segments of the graph?
What did the caterpillar have to do for the graph to return to the horizontal axis at the end?
https://www.gigaphysics.com/graphs_lab.html
Select Position vs. Time #3
Take a screenshot of your position/time graph and attach it.
What did the caterpillar have to do to create a steep first segment but a more gently sloping final segment?
https://www.gigaphysics.com/graphs_lab.html
Select Position vs. Time #4
Take a screenshot of your position/time graph and attach it.
What did the caterpillar have to do to create the curved graphed with a gradually steeper slope?
https://www.gigaphysics.com/graphs_lab.html
Select Velocity vs. Time #1
Take a screenshot of your velocity/time graph and attach it.
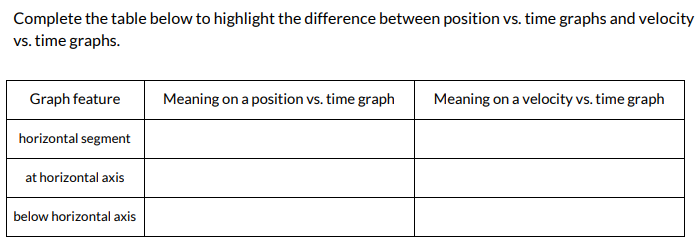
What does it mean when a velocity vs. time graph has a straight horizontal segment?
What did the caterpillar have to do to match the second, higher horizontal segment?
https://www.gigaphysics.com/graphs_lab.html
Select Velocity vs. Time #2
Take a screenshot of your velocity/time graph and attach it.
What does it mean when the velocity graph is below the x-axis instead of above it?
https://www.gigaphysics.com/graphs_lab.html
Select Velocity vs. Time #3
Take a screenshot of your velocity/time graph and attach it.
What did the caterpillar have to do to return to the horizontal axis at the end of its journey?
https://www.gigaphysics.com/graphs_lab.html
Select Velocity vs. Time #4
Take a screenshot of your velocity/time graph and attach it.
What did the caterpillar have to do for the final segment that sloped downward below the horizontal axis?
Open this video. Set the increment to 0.01 seconds (1 ms)
http://www.watchframebyframe.com/watch/yt/UZp2YFCJSXg
Create a copy of this Google Sheet Document to record your data: https://docs.google.com/spreadsheets/d/13zhIENiXpdMlDE3k_6pFT9h45KaY13w-qViiuI_hHr4/copy?usp=sharing
Download the pixel ruler below to measure the displacement of the ball.
Use: https://chrome.google.com/webstore/detail/page-ruler-redux/giejhjebcalaheckengmchjekofhhmal?hl=en
The ball in the video above is being dropped from 2.85 meters. Use the linked site to analyze the video and create a data table for the motion.
Attach a screenshot of your data table here.
http://www.watchframebyframe.com/watch/yt/UZp2YFCJSXg
Predict how a position/time graph would look for the motion in the video above.
Create a Position Time Graph using the data you have on your spreadsheet
http://www.watchframebyframe.com/watch/yt/UZp2YFCJSXg
Predict how a velocity/time graph would look for the motion in the video above.
Velocity/Time
http://www.watchframebyframe.com/watch/yt/UZp2YFCJSXg
Predict how an acceleration/time graph would look for the motion in the video above.
Acceleration/Time
Suppose that the graph below is a position vs. time graph that describes the motion of a dog.
Write a brief description of what the dog is doing in this graph.
Now suppose that the same graph instead represents the dog’s velocity vs. time.
Once again, write a brief description of what the dog is doing.


