Log in
Sign up for FREE
arrow_back
Library
Homework 12.3
By Colin Virshup
star
star
star
star
star
Share
share
Last updated about 1 month ago
10 questions
Add this activity
US Spending on Science, Space and Technology
Nicholas Cage
Even or Odd Functions
1
1
1
Discontinuous
1
1
1
The image below shows the US spending on Science, Space and Technology between the years 1999 and 2009.
Use this graph to answer the following questions
zoom_in
1
Question 1
1.
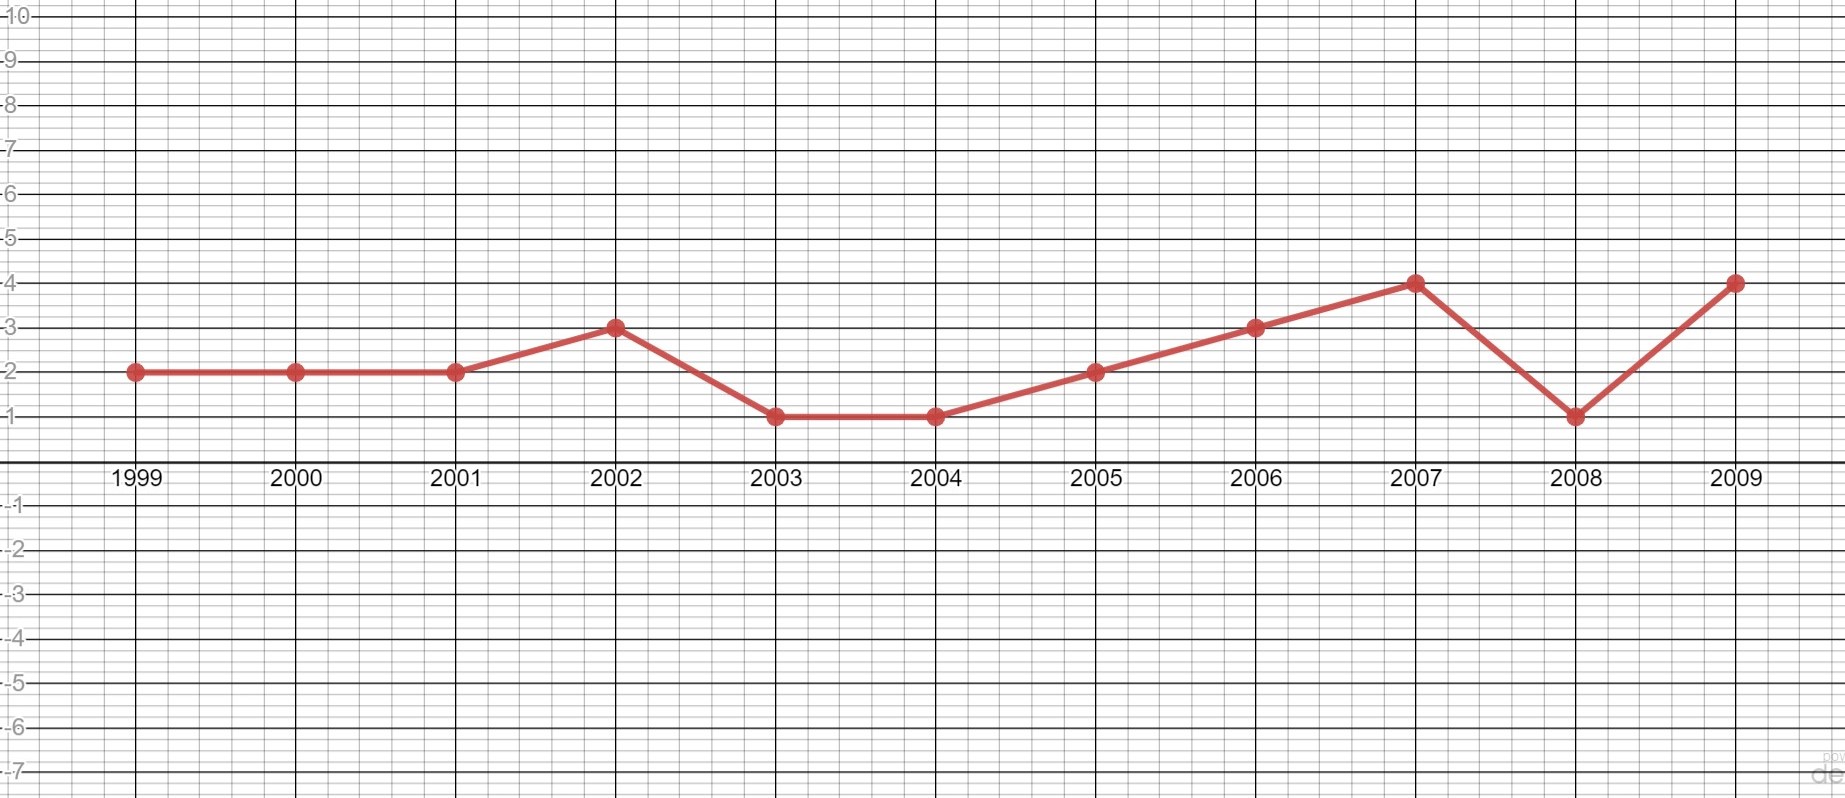
What is the relative maximum of billions of dollars spent between the years 2000 and 2003?
1
The graph below shows the number of films that Nic Cage has appeared in per year from 1999 to 2009. Use this graph to answer the following questions.
zoom_in
1
Question 3
3.
What is the relative minimum between the years of 2006 and 2009?
1
Question 5
5.
Question 6
6.
Question 7
7.
Question 8
8.
Question 9
9.
Question 10
10.
Question 2
2.
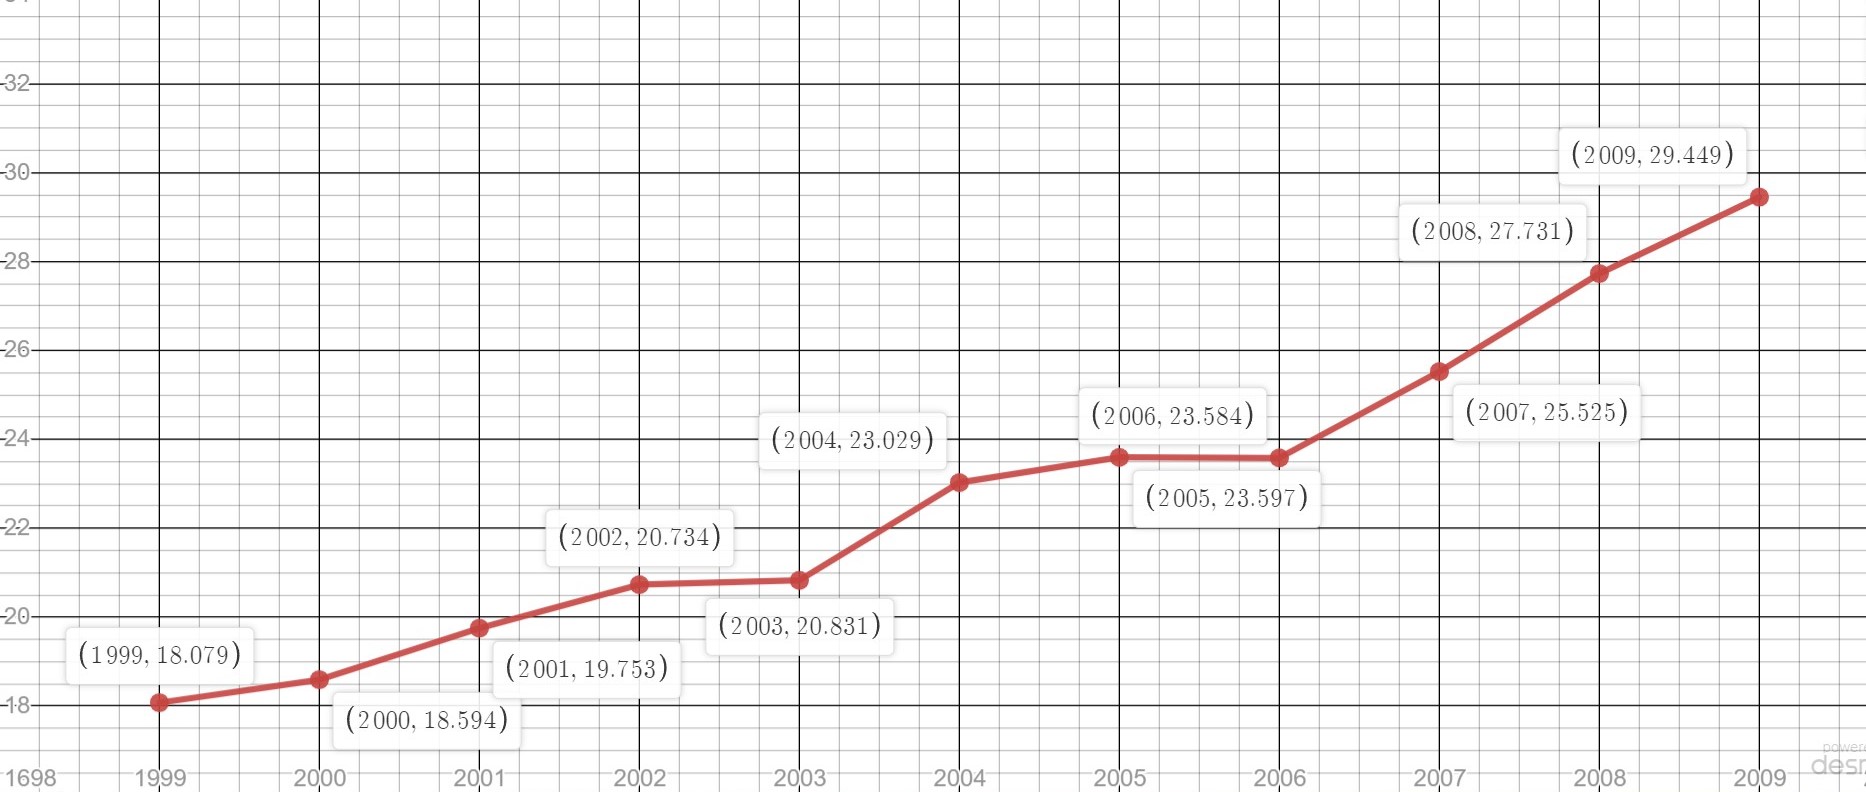
What is the relative minimum of billions of dollars spent between the years 2005 and 2009?
Question 4
4.
What is the interval in which Nic Cage's movies per year steadily rose?
Is the following function Even, Odd or Neither
f(x)=2x^{3}-2
Even
Odd
Neither
Is the following function Even, Odd or Neither
f(x)=2x^{3}
Even
Odd
Neither
Is the following function Even, Odd or Neither?
f(x)=x^{2}-3
Even
Odd
Neither
Is the following graph continuous or discontinuous?
Continuous
Discontinuous
Is the following graph continuous or discontinuous?
Continuous
Discontinuous
Is the following graph continuous or discontinuous?
Continuous
Discontinuous