Activity 6.5 Performance Task Box Plots
star
star
star
star
star
Posljednje ažuriranje about 4 years ago
3 questions
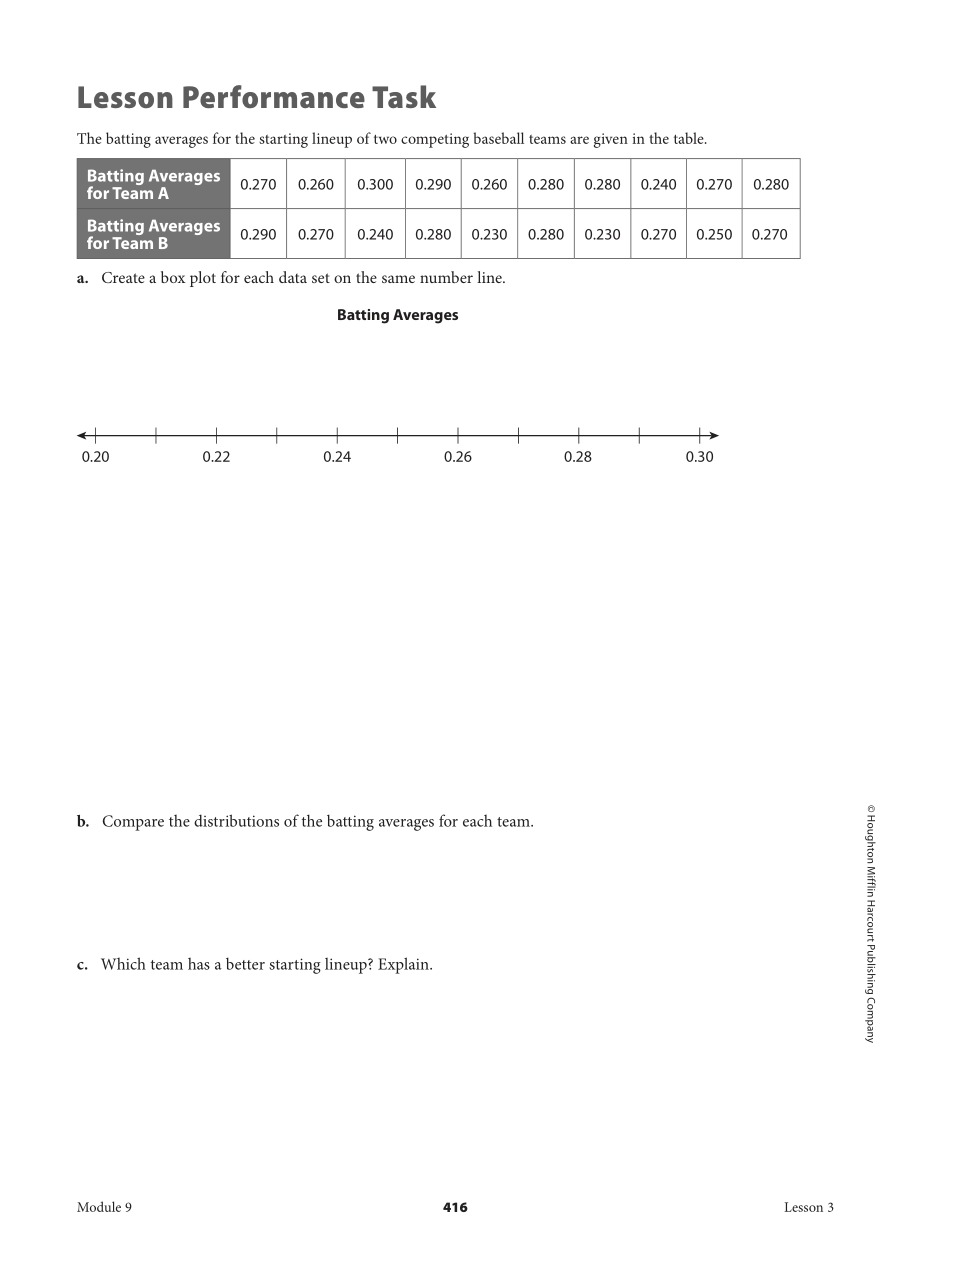
Create a box plot for each data set in google sheets. Export your graph into the show your work box. Lable the 5 number summary.
What is one conclusion you can make about the distribution of the batting averages for each team?
Which team has a better starting lineup? Explain using at least one statistic comparision.