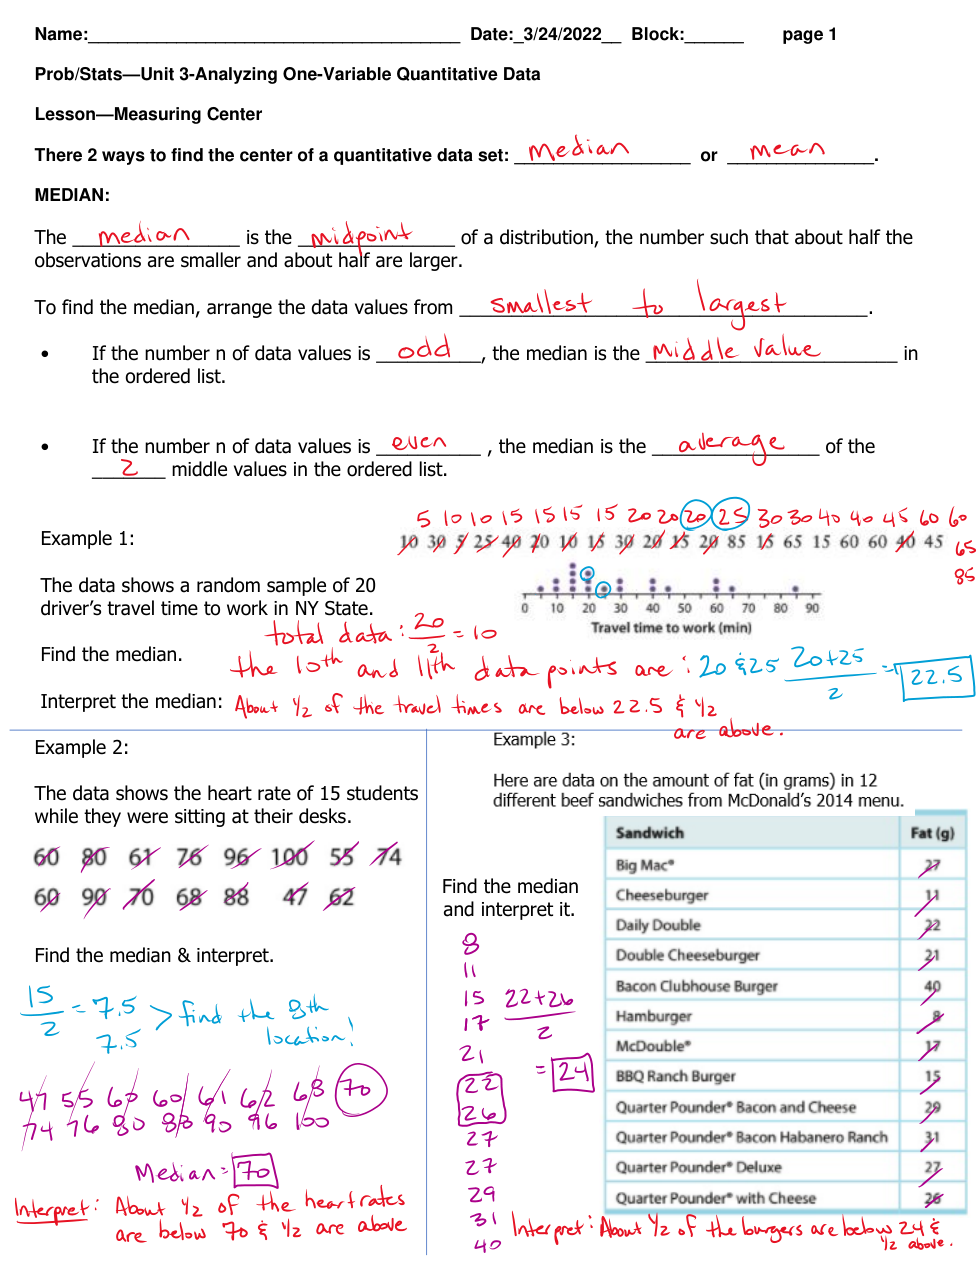
What is the median of the data set? (just type the number in the box)
Interpret the median using CONTEXT:
Calculate the mean travel time. (round to the tenths place)
Interpret the mean using CONTEXT:
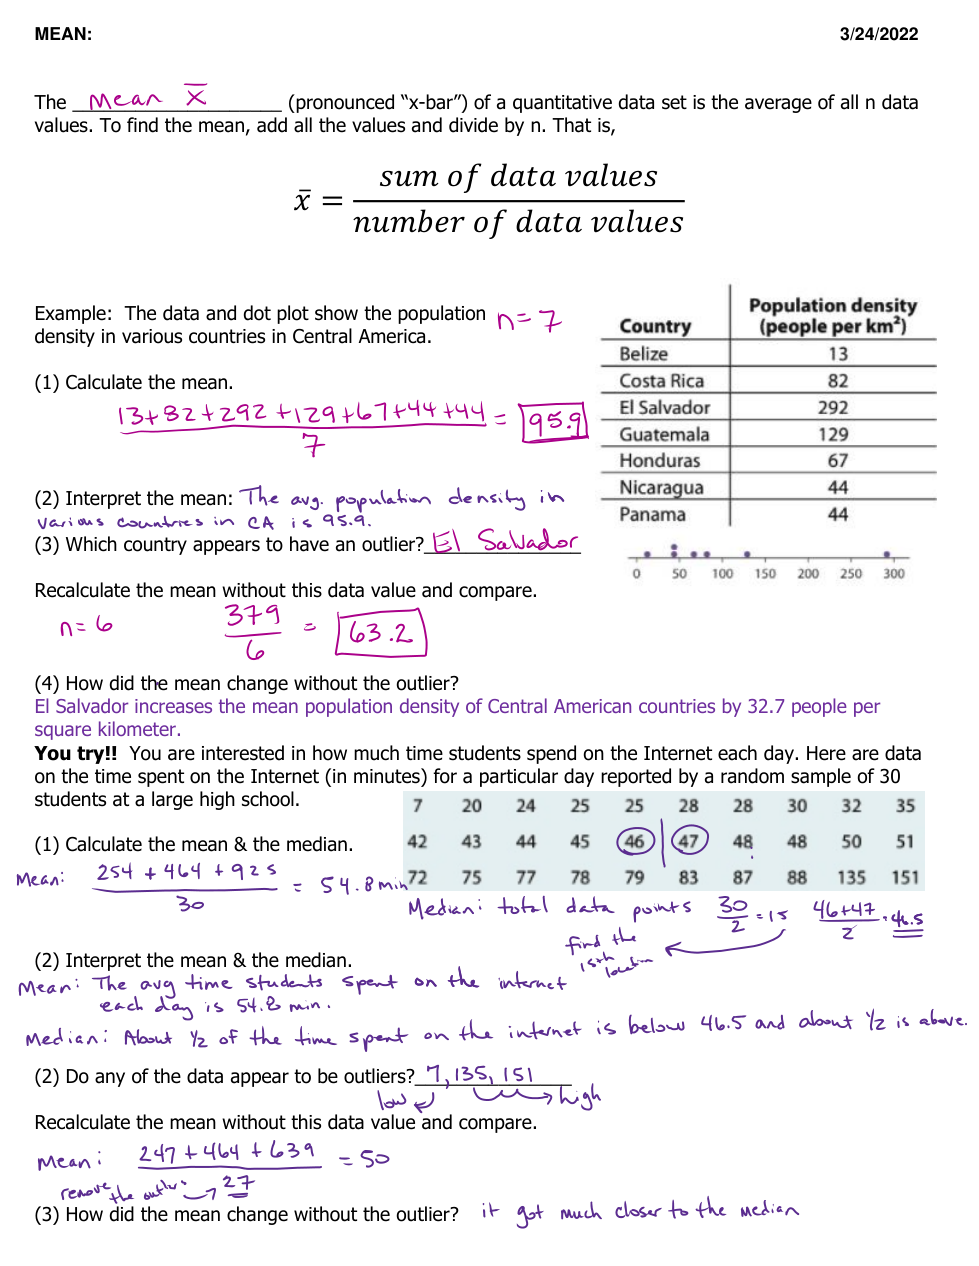
Find the median of the data set. (round to the tenths place)
Interpret the median using context.
Find the mean of the data set. (round to the tenths place)
Interpret the mean using context.
The following is a set of data describes the number of hours/week students studied at a university:
2 23 23 24 25 30 63 30 30
25 26 23 28 30 32 32 31 30
Given the set of data above, find the median.
(round to the tenth's place)
The following is a set of data describes the number of hours/week students studied at a university:
2 23 23 24 25 30 63 30 30
25 26 23 28 30 32 32 31 30
Given the set of data above, interpret the median using context.
The following is a set of data describes the number of hours/week students studied at a university:
2 23 23 24 25 30 63 30 30
25 26 23 28 30 32 32 31 30
Given the set of data above, find the mean.
(round to the tenth's place)
The following is a set of data describes the number of hours/week students studied at a university:
2 23 23 24 25 30 63 30 30
25 26 23 28 30 32 32 31 30
Given the set of data above, interpret the mean using context.
The following is a set of data describes the number of hours/week students studied at a university:
2 23 23 24 25 30 63 30 30
25 26 23 28 30 32 32 31 30
Which of the following values appear to be outliers in this data set?
The following is a set of data describes the number of hours/week students studied at a university:
2 23 23 24 25 30 63 30 30
25 26 23 28 30 32 32 31 30
Remove the outliers you selected in number 13 from the data set and recalculate the mean.
(round to the tenth's place)
The following is a set of data describes the number of hours/week students studied at a university:
2 23 23 24 25 30 63 30 30
25 26 23 28 30 32 32 31 30
Based on your answer in #14, how did removing the outliers affect the mean?

