3/24/2022-Quiz--Dot Plot, Stem Plot, Freq Tables & Histogram
star
star
star
star
star
Posljednje ažuriranje about 3 years ago
12
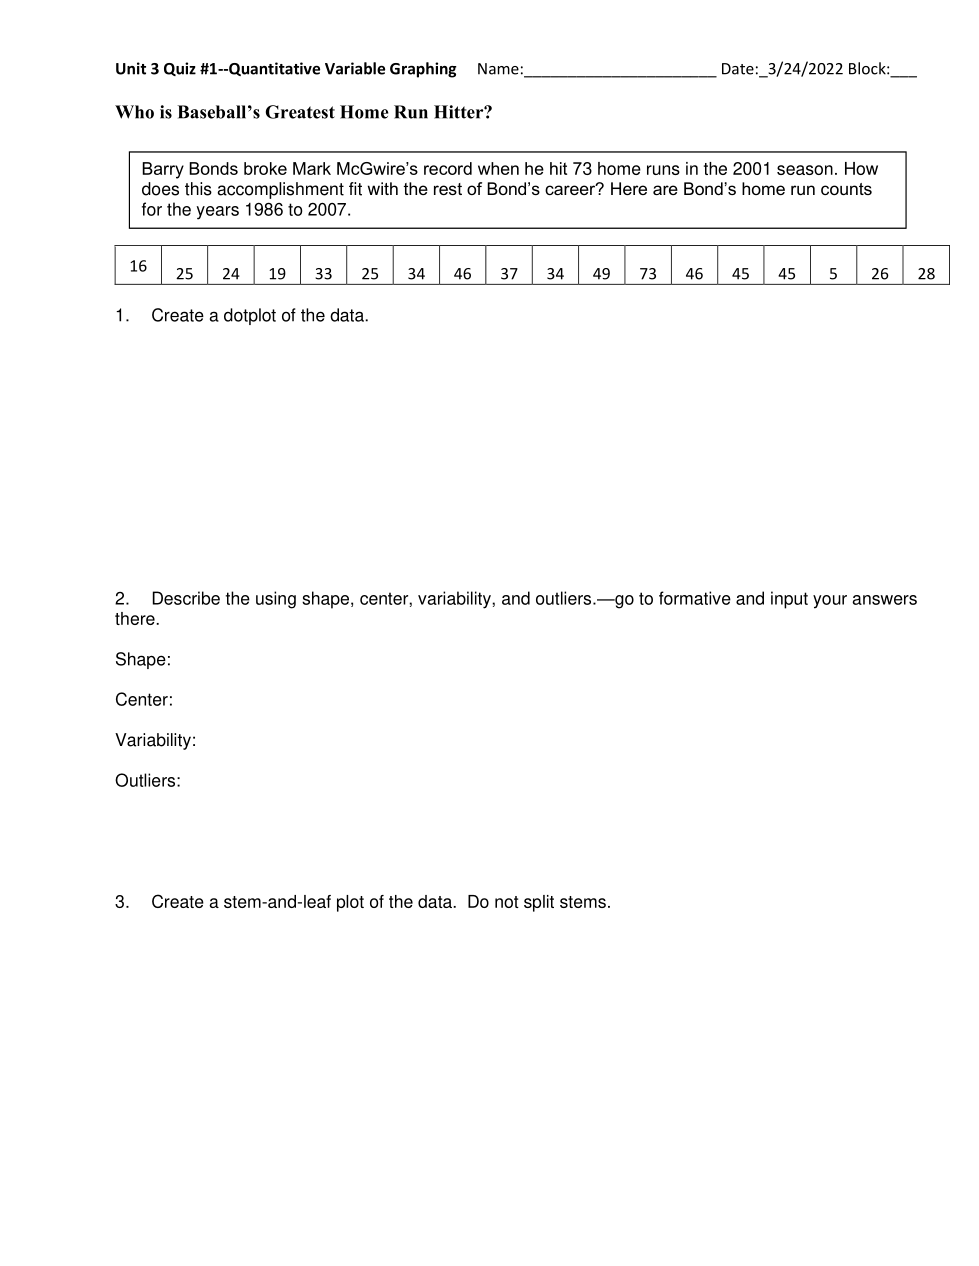
Create a dot plot of the data (by hand or use show your work)--upload any paper work into this question.
BE SURE TO LABEL YOUR GRAPH!
Create a frequency table by hand or inside show your work.--upload any paper work into this question.
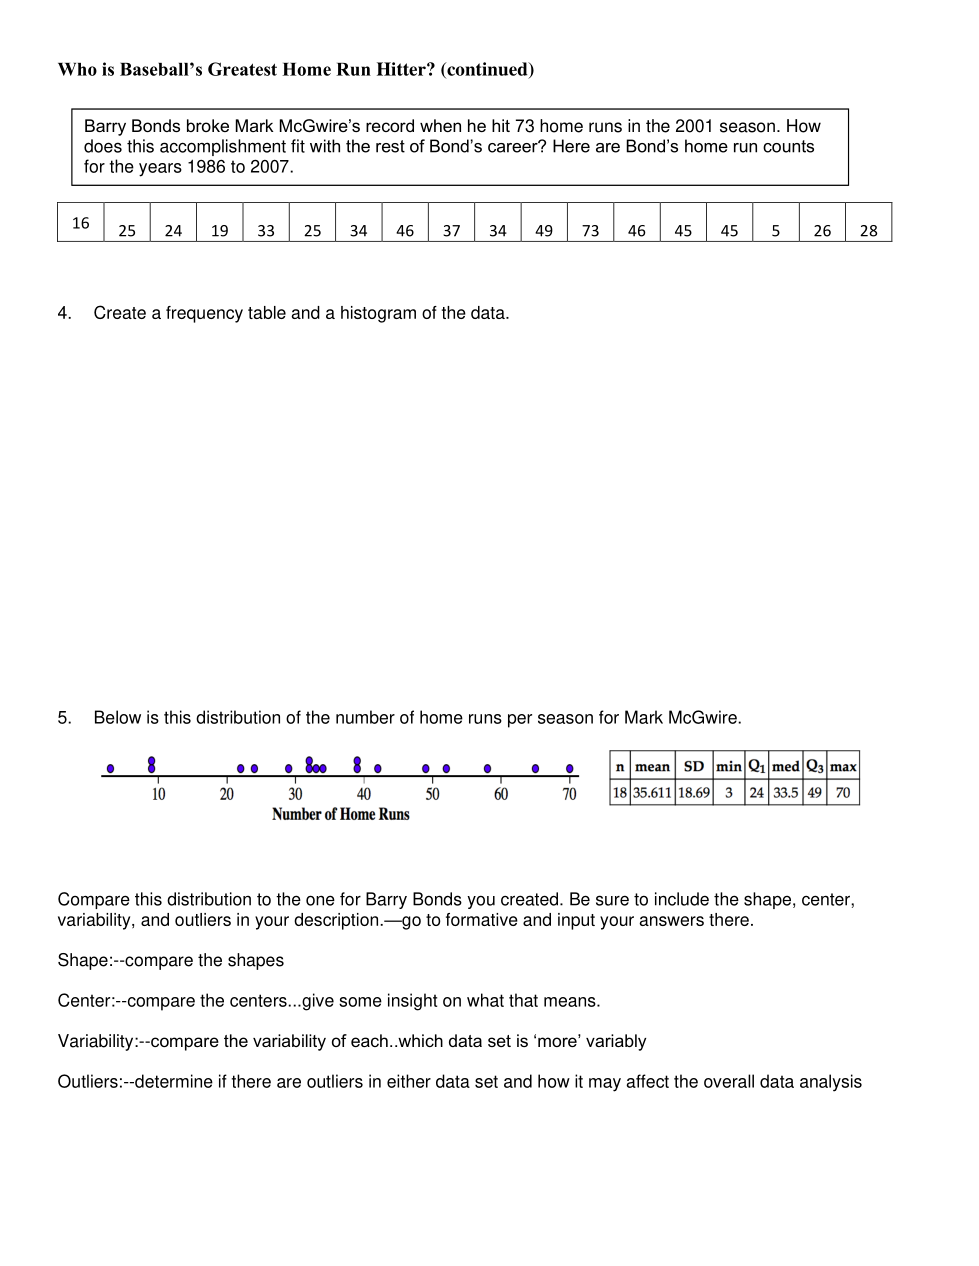
Compare the Shapes of the Bonds and McGwire data
(you might make a quick stem plot to better see the shape of McGwire)
Create a stem plot (by hand or use show your work)--upload any paper work into this question.
BE SURE TO LABEL YOUR GRAPH & PROVIDE A KEY!
Describe the shape
Describe the center
Describe the variability
Describe any outliers
Create a histogram by hand or inside show your work.--upload any paper work into this question.
BE SURE TO LABEL YOUR GRAPH!
Compare the centers of the Bonds and McGwire data
Compare the Variabilities of the Bonds and McGwire data
Compare any Outliers of the Bonds and McGuire data