HW 7.3 Linear Regression

Last updated over 3 years ago
15 questions
1

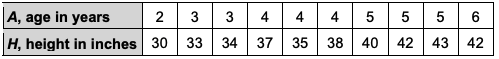
Bridget drew the trend line shown in the following scatter plot. Which statement best explains whether the trend line is a good fit for the data?

1

Describe the association of this graph

1

Draw a line of best fit to fit the data

1

Analyse the graph below.
Which statement(s) is correct:

1

Which equation represents the line of best fit for the data in the scatter plot? Show your work for full credit.

1

Which equation represents the line of best fit for the data in the scatter plot? Show your work for full credit.

1

Which equation represents the line of best fit for the data in the scatter plot? Show your work for full credit.


1

Using technology write an equation to model the table.

1

Using technology write an equation to model the table.

1

Using technology write an equation to model the table.

1

Using technology write an equation to model the table.

1

Using technology write an equation to model the table.

1

Using technology write an equation to model the table.

1

Predict the height at age 10.

1

How long will it take to get to 100 inches?