Set up a Force plate with a chromebook.
2. Open Graphical Analysis.
Impulse and Friction lab for Engineering a Shoe (unit 4) in the Patterns Physics curriculum.
Height and Mass Assigned
Hypothesis
I think that doubling the cushioning will the TIME of impact and will the impact force.
Set up a Force plate with a chromebook.
2. Open Graphical Analysis.
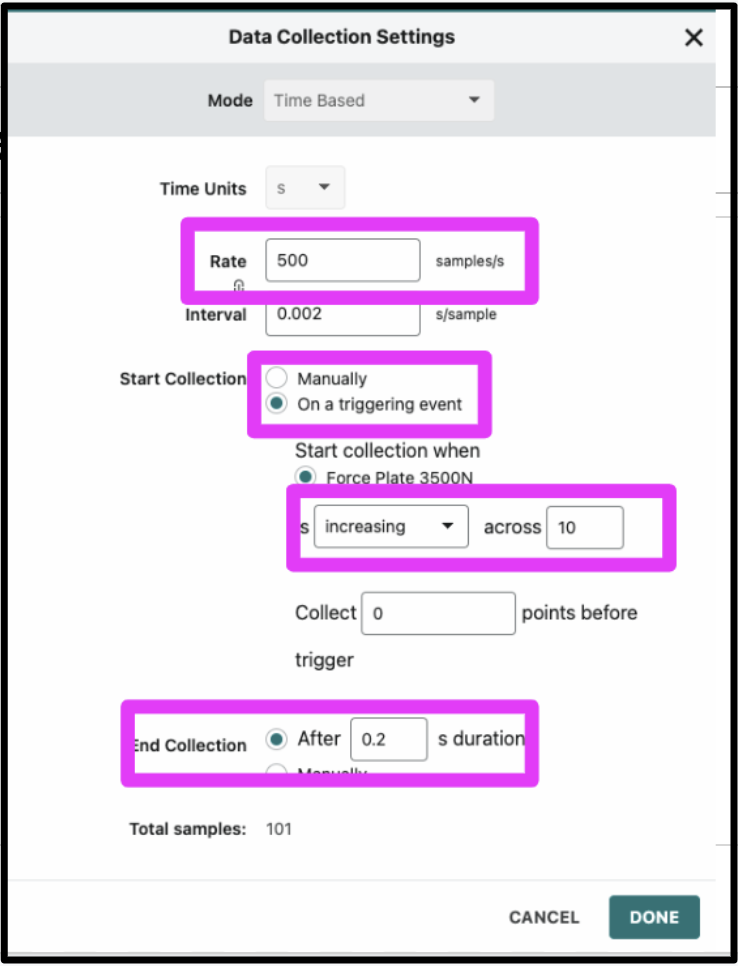
3. Change the "Data Collection Settings" by clicking on the bottom left corner of the screen.

4. Use the image below to set your Graphical Analysis software settings for Data Collection.
5. Drop the object from the assigned height with 1 piece of cushioning.
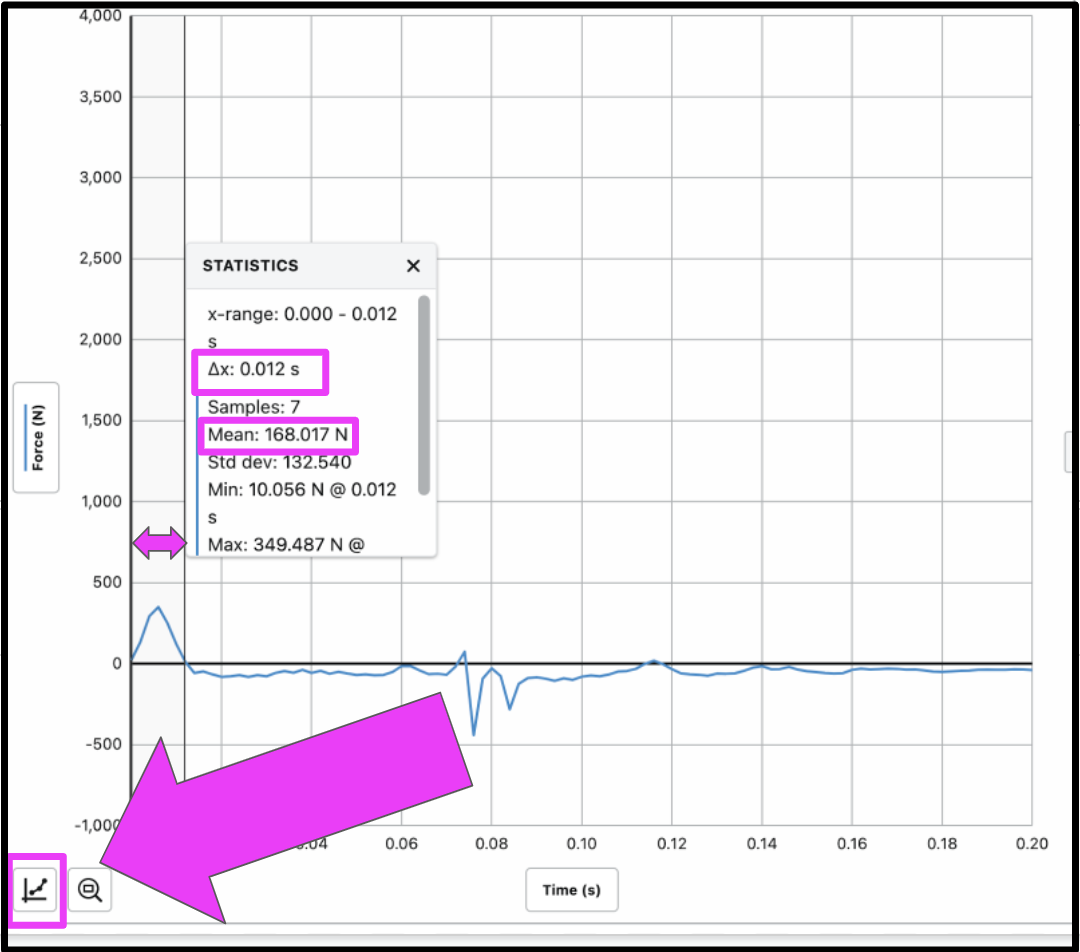
6. To find the time and force, select the "bump" that resulted and click the "Graph Tools" to find the IV, the change in time (
7. Enter your data in the data table. Repeat each drop for a total of 4 trials.
8. When you're done, take a screenshot of your completed data table and add it below.
>> Be sure to log in with your Google account and save your graph.
1. Change the A constant to decide which mathematical equation best fits the data.
2. Label the X and Y axes using the graph settings button (“wrench”) on the upper right of the screen.
3. Take a screenshot of your graph and add it below.
Choose the “generic” equation from the Desmos analysis that describes the relationship between time of impact and impact force:
Write down the mathematical model for the relationship between impact time and average impact force:
The mathematical model is the specific equation for the IV and DV with the A constant as a number and the correct letters for the IV and DV instead of X and Y.
Below is a part of the a lab report written by two students, Sal and Maryanne. In the report, each student makes their own hypothesis about the effect of force on the friction in a shoe.
Title of Experiment: Traction of Shoes Investigation
Performed by: Sal and Maryanne
We have been studying shoes in class. When you are trying to change direction or start to run, you want to make sure that you do not slip. In order to design our shoes better, we need to better understand how friction works. The aim of this experiment is to look at how the force pushing down on a shoe affects force of friction.
What is the primary force acting on the shoe that presses it to the ground?
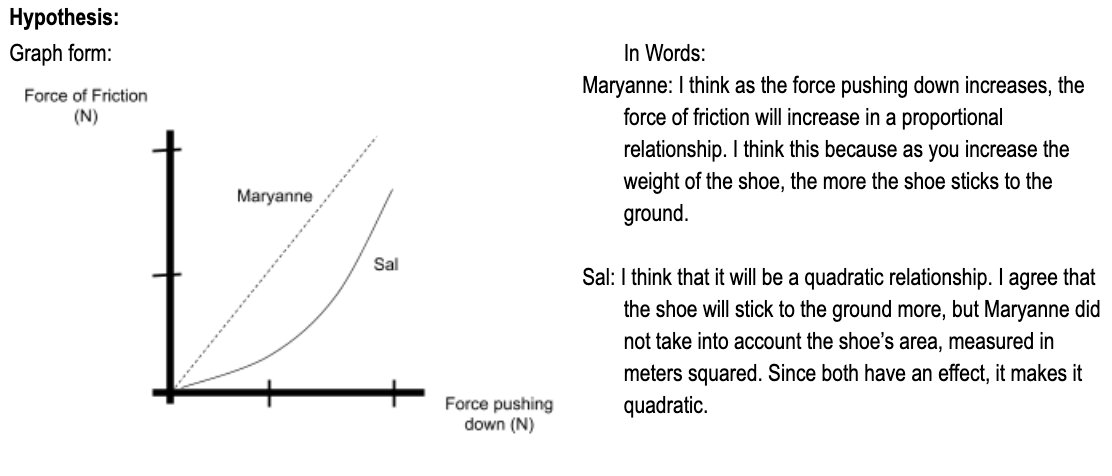
Of the two hypotheses above, which do you think is more correct?
Why did you pick that one?
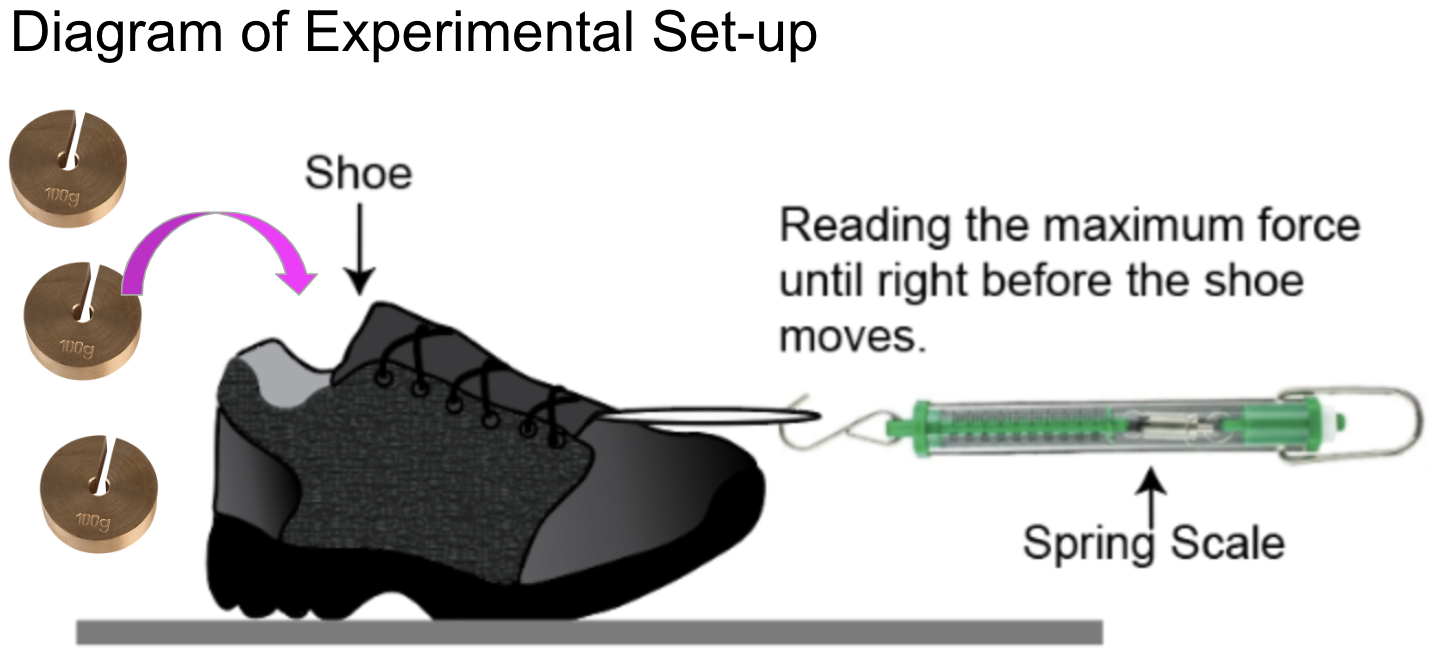
For each row you will add an additional 100 grams (0.100 kg) of mass to the shoe and then record the force on a spring scale.
After you are done collecting data, put a screenshot of your data table below.
>> Be sure to log in with your Google account and save your graph.
1. Change the A constant to decide which mathematical equation best fits the data.
2. Label the X and Y axes using the graph settings button (“wrench”) on the upper right of the screen.
3. Take a screenshot of your graph and add it below.
Choose the “generic” equation from the Desmos analysis that describes the relationship between the force pushing down on the shoe and the force of friction:
Write down the mathematical model for the relationship between normal force and frictional force:
The mathematical model is the specific equation for the IV and DV with the A constant as a number and the correct letters for the IV and DV instead of X and Y.
