AP Human Geography -- Unit 1 Test (Thinking Geographically)
Part A: Multiple-Choice (40 points)
Multiple choice: Choose the option that best answers the question or completes the statement.
This is an assessment. There may not be any notes out. Put all phones away. No index cards. No outside resources.
Each MCQ is worth 1 point.

The map to the left is an example of which type of map?
These types of regions are typically used to determine and outline governmental, cultural and economical areas.
What type of research is the US Census considered to be?
________________ states that technology is allowing us to communicate more across longer distances. This makes it seem like we are closer together, even though we technically aren't.
The picture represents--
One layer of data in the image is known as
Which of the following best describes a functional region?
Which of the following is a renewable resource?
Satellite Navigation Systems are also called
"The South" is a

The image at left is an example of which type of settlement?
Visiting your elementary school or hometown brings back emotional feelings. What is the name of that effect?
The address 6001 Dodge St, Omaha, NE is an example of--
Select all that apply. Maps can distort all except which of the following?
Environmental sustainability is defined by which of the following?
Environmental determinism is the belief that

The map at left is an example of a
Which spatial patterns on the maps shown would be most helpful to someone selecting the location for a new coffee shop?
A nongovernmental organization is planning a new international elementary education program. Based on the map shown, which of the following groups of countries would be the best candidates to receive funding?
Which of the following best describes the spatial pattern of adult literacy rates presented in the map?
Which of the following concepts best explains the differences among the values shown in the table?
Which of the following terms best describes the suburban area of Illinois where many residents commute to Chicago?
Which of the following describes an outdated, former scientific viewpoint that perpetuates racism?
Which of the following is not one of the ways map scale can be presented?
Lines of latitude run
A toponym is a

What is the scale of this map?
What is the scale of analysis of this map?

The scale of analysis of this map is?
The scale of this map is?
What type of map is this?

The scale of this map is...
The scale of analysis of this map is...
The cultural landscape is defined as...
What is the scale of this map?
What is the scale of analysis of this map?
What data does this map show?
What kind of data is this?
The maps show data most likely collected through
The data in the maps is
Part B: Vocab Matching (20 points)
Matching: Identify the letter that best defines the vocabulary term. In the blank, only write the letter. For example, if A's definition in the box to the right was cultural landscape, you would type the letter A in the box below "Cultural landscape"
This is an assessment. There may not be any notes out. Put all phones away. No index cards. No outside resources.
Each vocab term is worth 1/2 point.
A - A 3D map placed onto a flat surface will always have this.
B - Numerical data, such as the Census
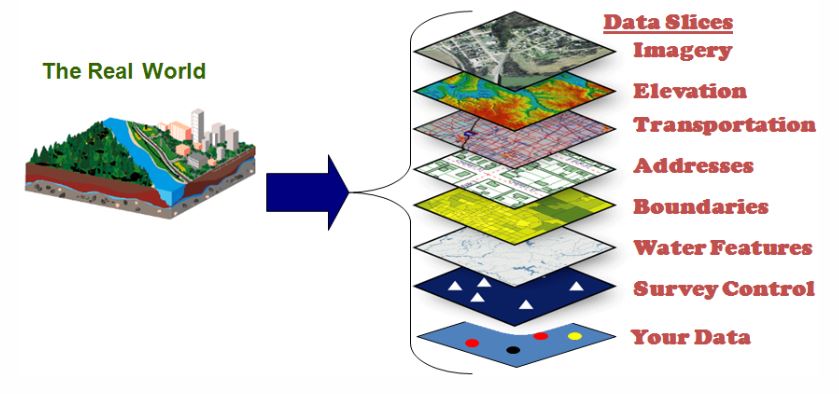
C - Layers of data gathered through methods like aerial photography & balloons
D - The location of a place described using other landmarks around it
E - a region that is different in everyone's mind
F - a map that shows a small amount of detail
G - how geographic data is analyzed
H - population count done every 10 years
I - the feeling of not having a place, middle of nowhere
J - the further you move from a starting place, the less connected people will be
K - the environment has no bearing on human destiny
L - place name
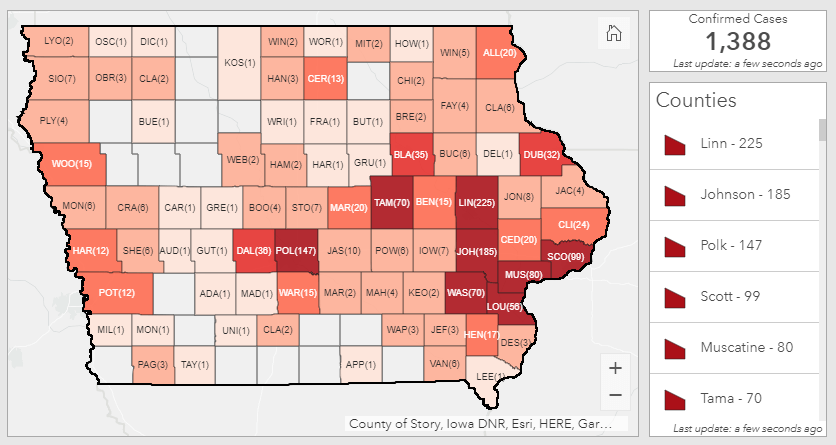
M - a map that uses symbols that change size based on value
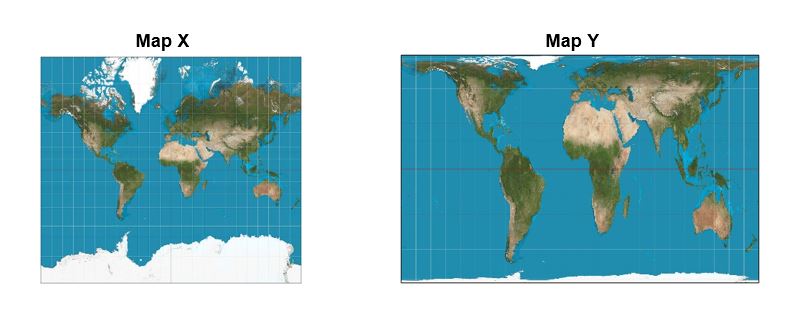
N - map projection that distorts Greenland + Africa
O - the exact location of a city, able to find on a map
P - vertically-stretched map projection
Q - feeling you get when visiting your hometown/ES
R - a resource such as solar, wind and hydro
S - a resource such as gas, coal and oil
T - the environment places some restrictions but we can overcome
U - many houses placed right next to each other, type of settlement pattern
V - tech + transit are making it feel as if we are getting closer together than ever before
W - conserving resources for the next generations while making sure we have a good life
X - a map that shows a lot of detail
Y - map projection typically used in atlases
Z - Grand Central Station is an example of this region
perceptual region
relative location
distortion
quantitative
US Census
GIS
placelessness
distance decay
cultural determinism
graduated symbol map
scales of analysis
small-scale
toponym
functional region
absolute location OR site
Mercator projection
Peters projection
Robinson projection
sense of place
clustered
time-space compression
environmental possibilism
sustainability
non-renewable resource
renewable resource
large-scale map
**THE VOCAB MATCHING SECTION CONTINUES DOWN HERE**
Any definition with two letters will only go to the questions below. Do not return to the previous section to change a definition.
AA - map that uses a dot to represent a specific value
BB - the human imprint on the landscape. everything we have done.
CC - map that uses colors and shading
DD - data that uses opinions, questionnaires, survey
EE - the surrounding area of the city. not describing in relation to something else, just the characteristics of the outside of the settlement
FF - a region with a strict definition that has uniformity in one or more characteristics
GG - a system of satellites in space that receives and sends information to/from Earth
HH - connections, movement, flow, conacts of things between places
II - most weather maps are this type of map
JJ - most maps of migrations are this type of map
KK - an outdated, former scientific viewpoint that perpetuates racism
MM - houses spread out with a lot of space between them
NN - study of how humans interact with the environment
OO - map that changes the size of countries to represent increasing values
formal region
situation
qualitative data
GPS
dispersed
spatial interactions
cultural landscape
cultural ecology
environmental determinism
choropleth map
dot map
cartogram
isoline map
flowline map
Part C: Free-Response (21 points)
Free-response: Answer all seven parts of the question to the best of your ability. Remember yesterday's tutorial.
This is an assessment. There may not be any notes out. Put all phones away. No index cards. No outside resources.
This FRQ is worth 3 points per part.
a) Define map projection.
b) Identify the Mercator projection and Peters projection.
c) Describe one advantage and one disadvantage of using the Mercator projection.
d) Describe one advantage and one disadvantage of using the Peters projection.
e) Explain why all map projections have some level of distortion.
f) Explain why Google Maps uses the Mercator projection.
g) Compare the Mercator projection with the Peters projection in terms of distortion.
Part D: Bonus (5 points)
Bonus: This question is optional. Answer them as best you can.
This is an assessment. There may not be any notes out. Put all phones away. No index cards. No outside resources.
This question is worth 5 points.
Explain how the theory that the environment alone controls human destiny was used to perpetuate racism in the 18th Century?