Log in
Sign up for FREE
arrow_back
Library

Topic A Quiz, Module 6

star
star
star
star
star
Last updated over 3 years ago
5 questions
Required
1
6.SP.A.1
Required
2
6.SP.A.1
Required
1
6.SP.B.4.a
6.SP.B.5.a
Required
1
6.SP.A.2
1
6.SP.B.4.a
Question 1
1.

Which question is a statistical question? Select ALL that apply.

Question 2
2.

Consider the data sets listed. Place the data set in the corret category, depending on whether the data are numerical or categorical.

  • Color of book bag for 30 seventh graders
  • The time it takes 24 runners to complete the race
  • Number of books each of 18 teachers owns at home
  • The clubs and activities that 40 eighth graders participate in after school
  • Numercial Data
Question 3
3.
Other Answer Choices:
17
5
9
12
13
11
10
19
20
4
16
6
18
15
1
3
7
14
8
2
Question 4
4.
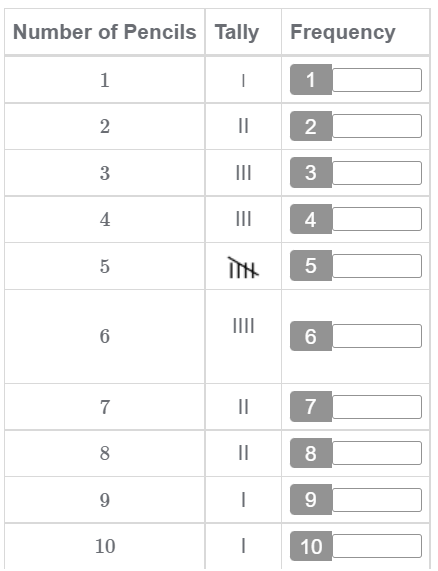
Jamal collected data to answer the following question: How many pencils does each student in my class have in his or her desk? The following is a frequency table of the data he colleted. Complete the frequency table.
Other Answer Choices:
3
3
2
1
2
1
5
2
1
4
Question 5
5.

Create a dot plot of the data collected.

What is your favorite movie?
What is the age of each child currently at the zoo?
How many pages are in the book you are reading?
How many pairs of shoes do students in your school have?
Weight of 12 animals at the veterinary hospital
Favorite subject of all 28 sixth graders in Mrs. Kinsey's homeroom
Categorical Data
A sixth-grade class collected data on the number of books read by each student during a one-month period. The data colletd are shown in the dot plot, where each dot represents a different students response. Match each question about the data to the corret reponse.

How many students are in the class?_______

How many students read more than 3 books?______

What number of books was read by the most students?______

How many students read exactly 1 book?______

How many students read fewer than 4 books?_______

What is the greatest number of books read?______