Ɛhia
1
7.6.G
Ɛhia
1
7.6.G
Ɛhia
1
7.12.A
7.6.G
Ɛhia
1
7.12.A
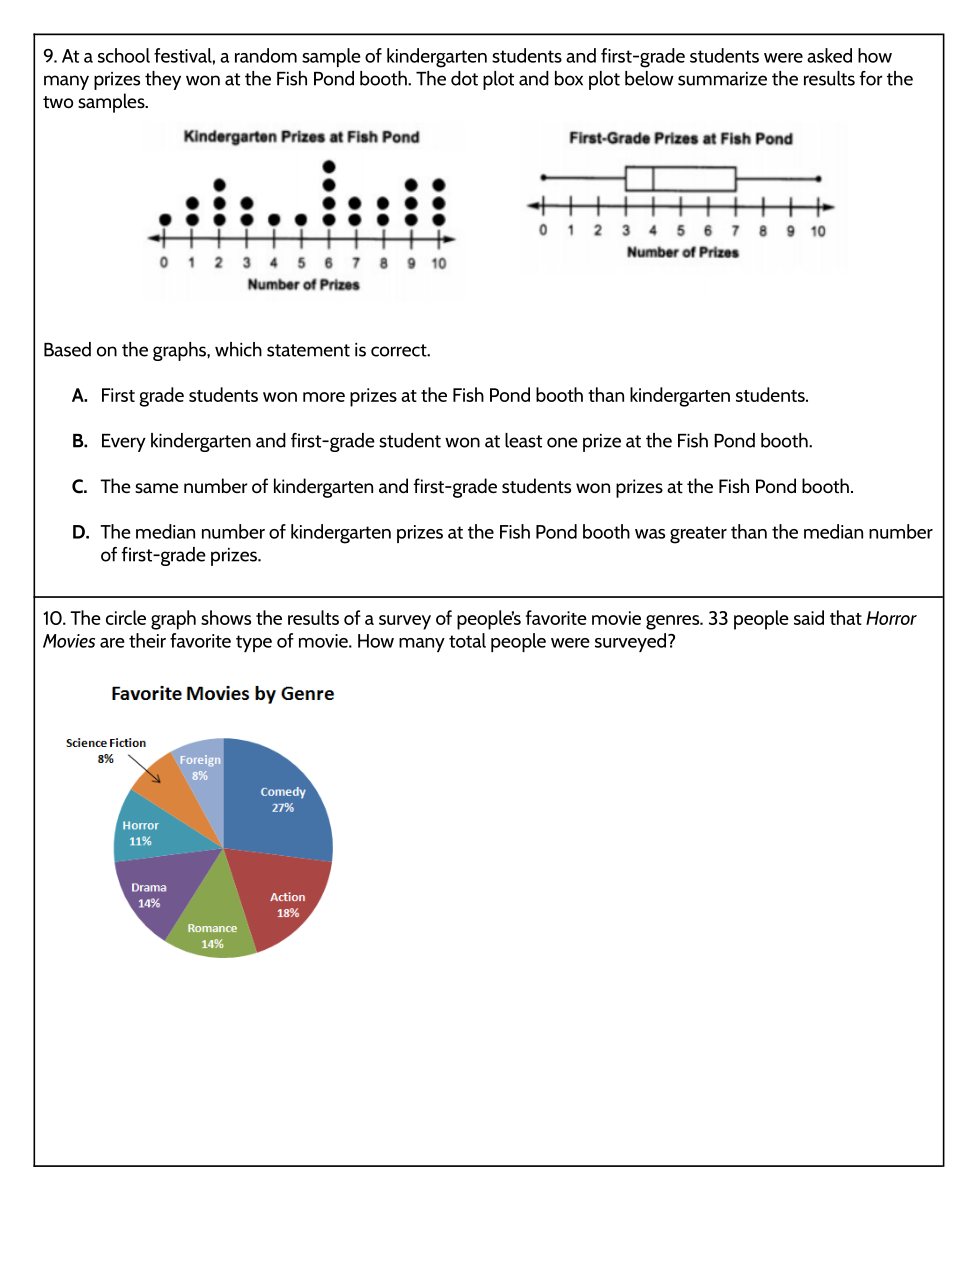
Based on the graphs, which statement is correct?
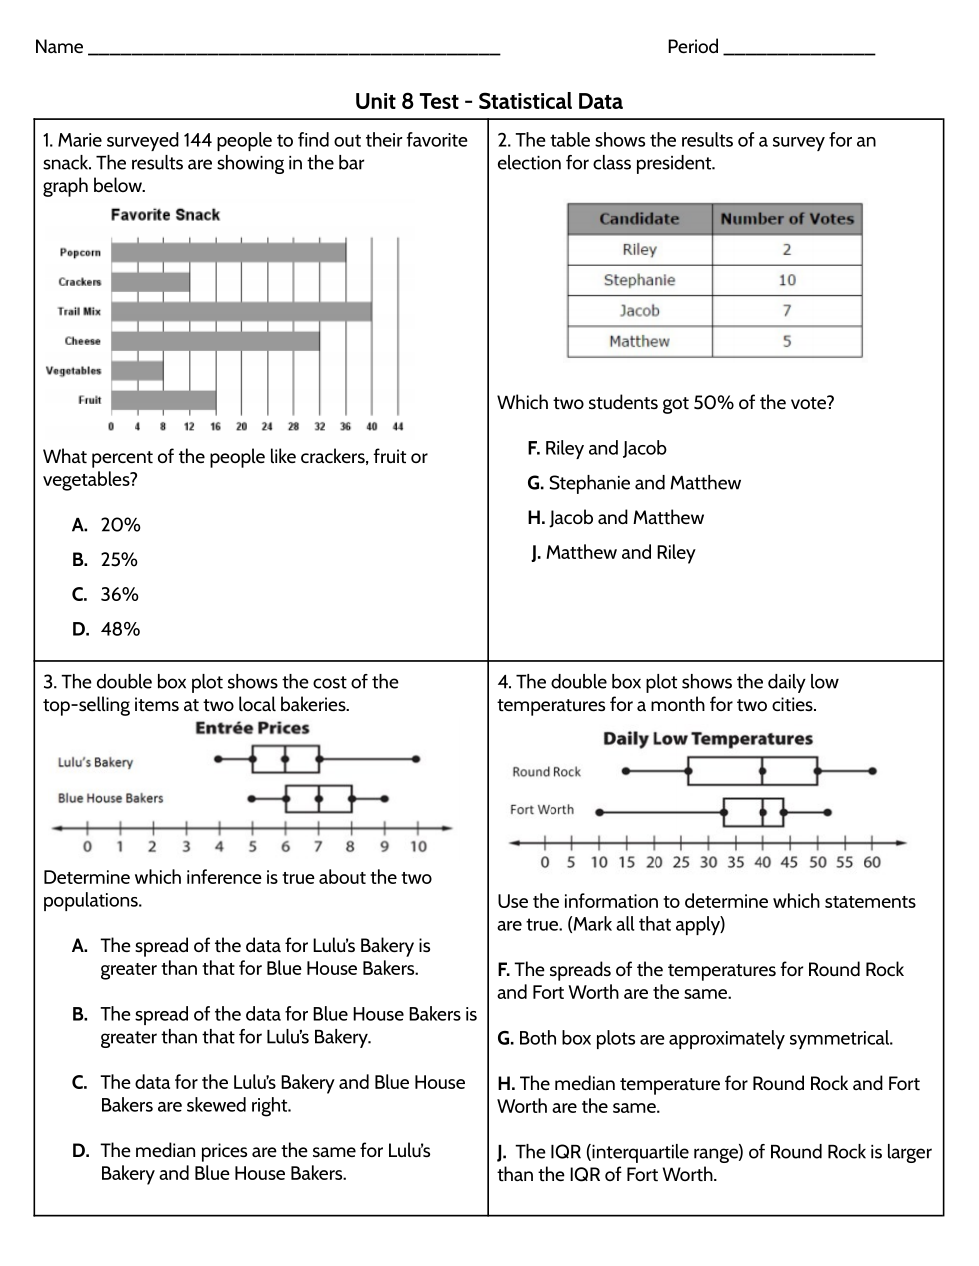
What percent of the people like crackers, fruit, or vegetables?
Which two students make up 50% of the vote?
Determine which inference is true about the two populations.
Use the information to determine which statements are true. (Mark all that apply)
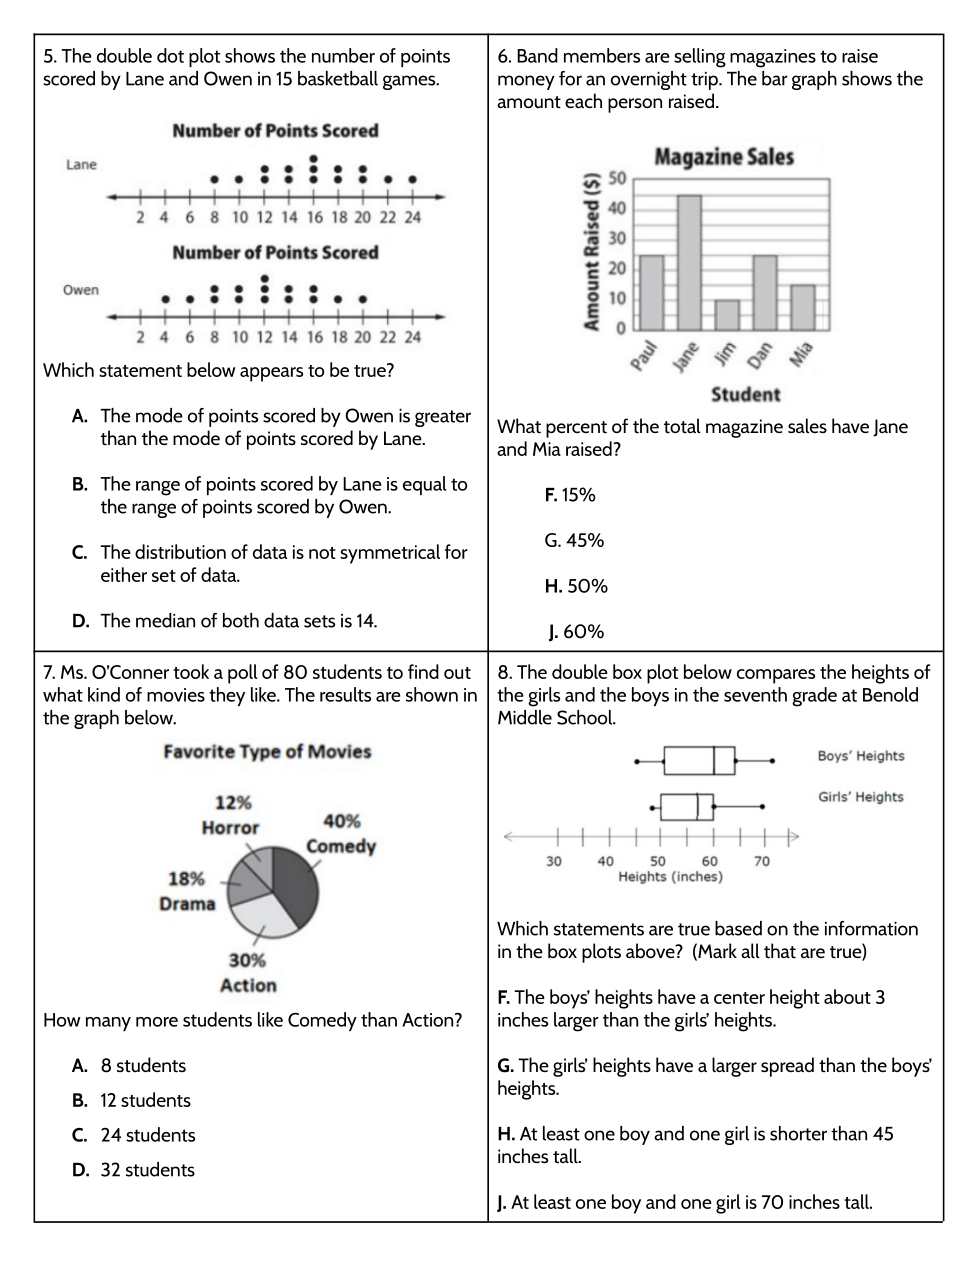
Which statement below appears to be true?
What percent of the total magazine sales have Jane and Mia raised?
How many more students like Comedy than Action?
Which statements are true based on the information in the box plots above? (Mark all that are true)
How many total people were surveyed?