Station 3: Level 3 - AAC
star
star
star
star
star
Posljednje ažuriranje over 3 years ago
18
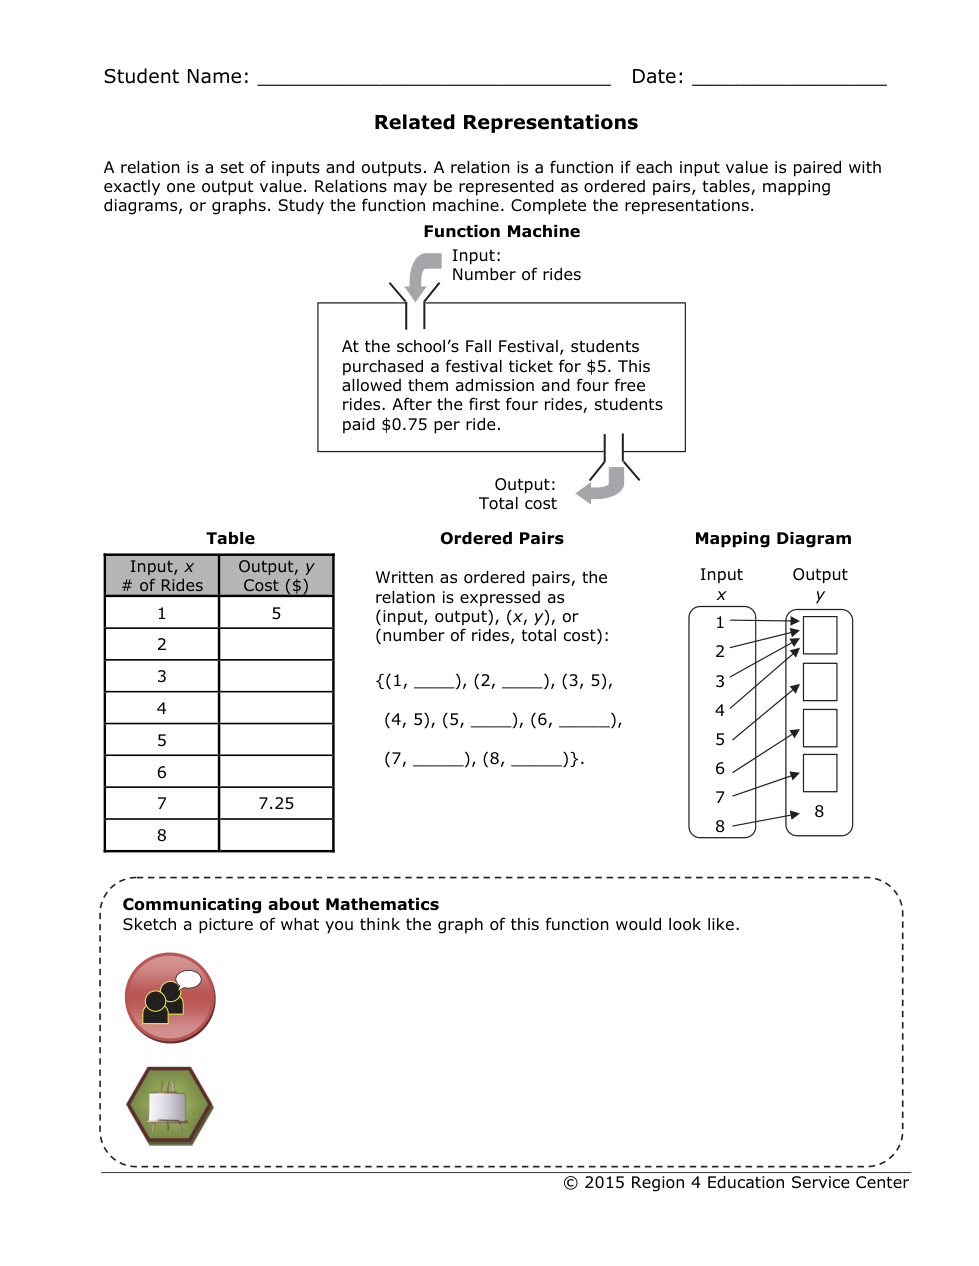
Fill in the value for the table.
When input is 2 the output is:
Fill in the value for the table.
When input is 3 the output is:
Fill in the value for the table.
When input is 4 the output is:
Fill in the value for the table.
When input is 5 the output is:
Fill in the value for the table.
When input is 6 the output is:
Fill in the value for the table.
When input is 8 the output is:
Fill in the value of the ordered pair.
When x is 1, y is:
Fill in the value of the ordered pair.
When x is 2, y is:
Fill in the value of the ordered pair.
When x is 5, y is:
Fill in the value of the ordered pair.
When x is 6, y is:
Fill in the value of the ordered pair.
When x is 7, y is:
Fill in the value of the ordered pair.
When x is 8, y is:
Fill in the value in mapping diagram.
When input is 1, 2, 3, and 4 the output is:
Fill in the value in mapping diagram.
When input is 5 the output is:
Fill in the value in mapping diagram.
When input is 6 the output is:
Fill in the value in mapping diagram.
When input is 7 the output is:
Plot the points
How to:
Click anywhere on the graph.
click on the little bubble that pops up when you clicked
click on the x value
type in your x value
then click on your y value
type in your y value
Happy graphing!!!
Function Yes or No?