If you graph the quadratic function y = x2. The graph is a parabola as shown to the right.
IMPORTANT!!!!
You will need DESMOS to plot all the equations that are a part of this investigation. When using DESMOS, make sure you insert only the expression and not the entire equation.
For example, if I ask you to plot
then on DESMOS enter only
Also, note: In the previous class, I only marked absent the students who did absolutely no work. Today, I will be much stricter. I am not looking for exact answers, I am looking for sincere participation. If your Formatiev App is not working, take help from a friend and complete the task on a google doc. Share the doc with me at the end.
If you graph the quadratic function y = x2. The graph is a parabola as shown to the right.
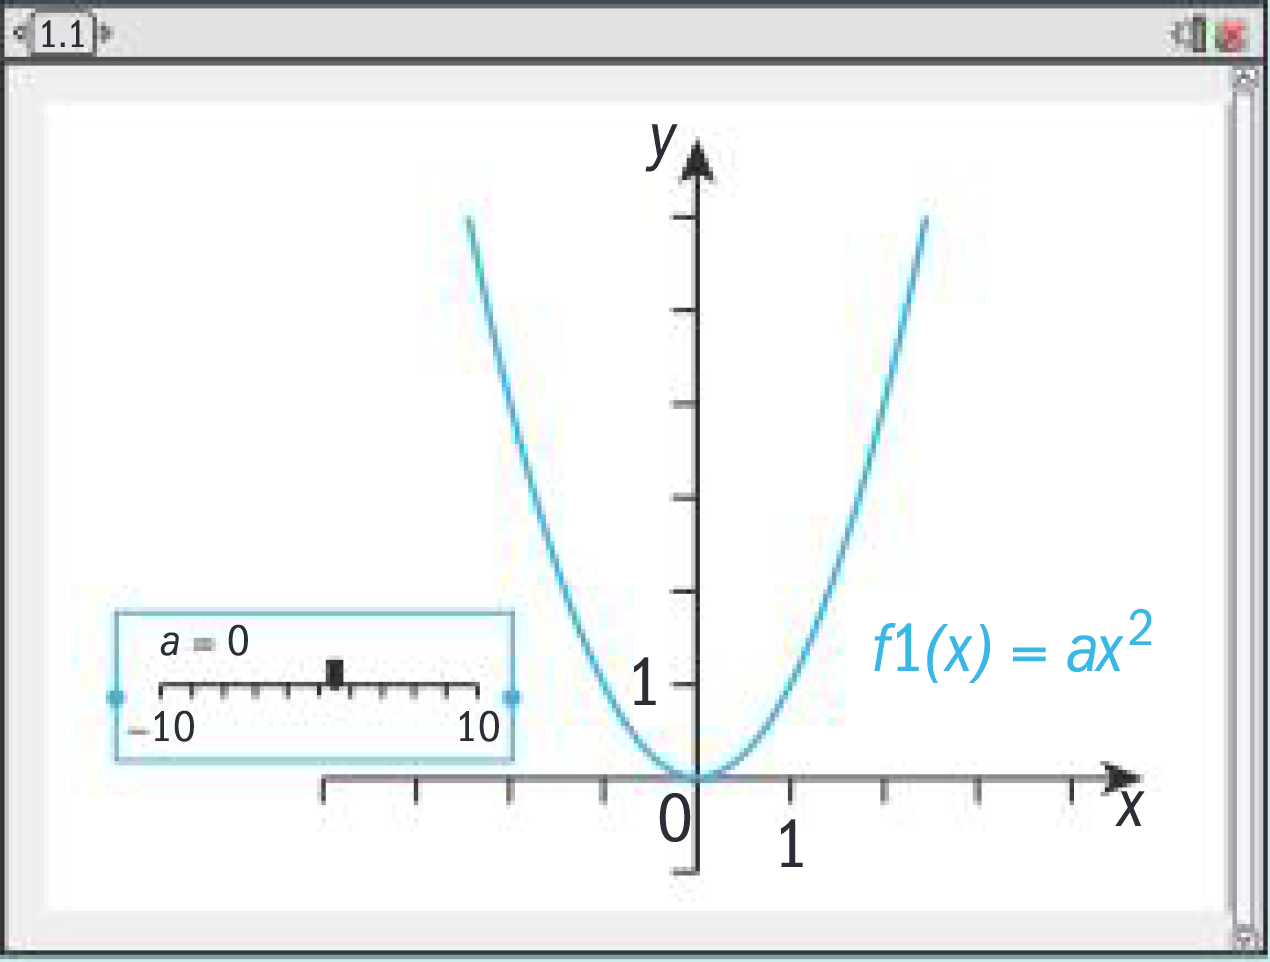
Go to DESMOS and Graph:
for a few values of a between 10 and +10.
Find the values of a for which the parabola is concave up.
Find the values of a for which the parabola is concave down.
Find the values of a that make the parabola narrower than the graph
of y = x^2
Find the values of a that make the parabola wider than the graph of y = x^2
Describe the effects of changing the value of c.
Graph y = x^2 + bx for different values of b between 10 and +10. Include
some non-integer values. Describe the effect of changing the value of b.
Graph the linear function y = bx for different values of b. Describe how
the graph changes for different values of b
Go back to the parabola y = ax^2 + bx. Give a any value except 0. Keep a fixed and change b. Describe how the shape of the parabola changes for different values of b