1
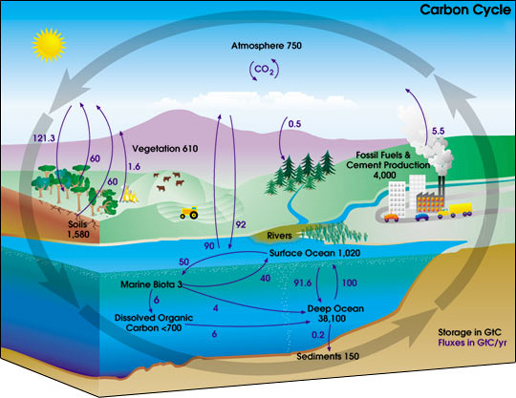
Which is the largest carbon sink (storage)?
Which is the largest carbon sink (storage)?
1
1
1
1
1
1
1
What happens to solid waste excreted by organisms in the ocean?
What are the 3 most important gasses in the ocean?
How is a MAJORITY of oxygen produced in the ocean?
How is a MAJORITY of carbon dioxide produced in the ocean?
Inorganic carbon that dissolves in the ocean from the atmosphere is converted into organic compounds by
Which is the largest carbon sink (storage)?
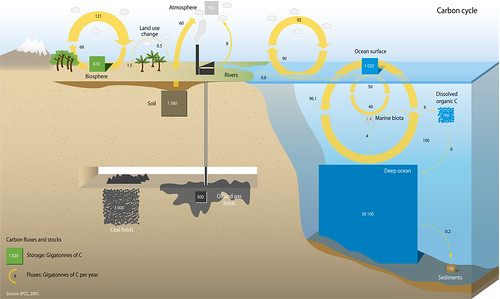
Use either the NASA or IPCC diagrams to complete the flow diagram below. It should represent the carbon sink and amounts in GtC (gigatonnes of carbon) and GtC/year (gigatonnes of carbon per year).
Fill in:
boxes representing sinks without names
sinks without carbon amounts
arrow lines without a directional arrowhead
arrows without flux amounts
What are sources of dissolved substances in seawater?
What is ocean acidification?
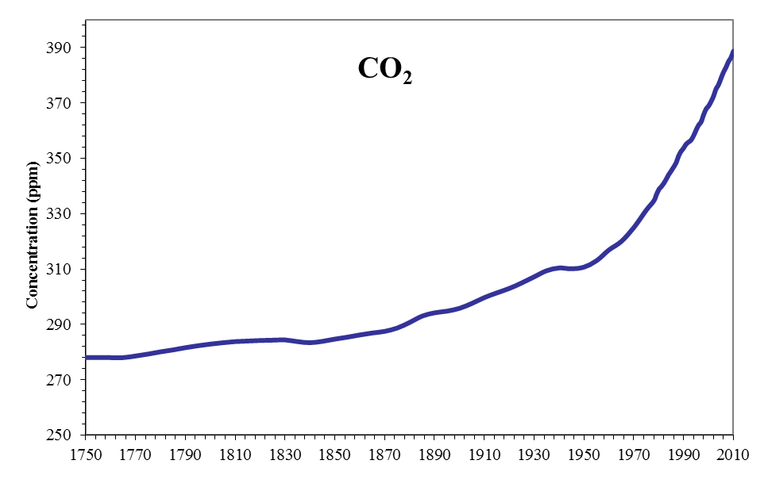
What has happened to carbon dioxide levels in the atmosphere since the 1850's?
Why has this change occured?
How do rising atmospheric levels of carbon dioxide affect ocean chemistry
What organisms are most at risk from ocean acidification?
How will ocean acidification affect marine organisms with calcified structures?
How does ocean acidification affect plankton?
How does ocean acidification affect clownfish?
Why is the rate of atmospheric carbon dioxide increase such a cause for concern?
Will ocean acidification affect organisms with silica skeletons? Why or why not?
Pick one marine organism and research how ocean acidification affects them.
Which is the smallest carbon sink shown?
How much carbon (GtC) is held in soil?
How much carbon (GtC) is held in fossil fuels (oil, gas and coal)?
Where is there a ‘two-way’ movement (flux) of carbon?
Between which stores is the largest flux of carbon? How much carbon is involved?
How much carbon goes into the atmosphere as a result of using fossil fuels and cement production (GtC/year)?
Find two differences in information between cycles in these diagrams. Why do you think this is?