Consider the function shown in the graph.

A vertical shift up of how many units will map f(x) to g(x)?
Consider the function shown in the graph.
A vertical shift up of how many units will map f(x) to g(x)?
Consider the function shown in the graph.
A vertical shift up of how many units will map f(x) to g(x)?
Given the function f(x):
What is the value of k that was added to f(x) to create g(x)?

k=?
Consider the equations shown.
A vertical shift of ____?____ units up will map f(x) onto g(x).
Consider the graph, where g(x) represents a transformation of f(x).

If g(x)=f(x)+k, what is the value of k?
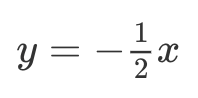
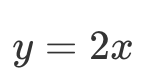
Graph the linear function:
Graph the linear function:
Which graph best represents the line that passes through the points (-3, 4) and (1,-6)?
The equation shown models the height of a candle after lighting it, where m represents the time the candle has been burning, in minutes, and h represents the candle's height, in inches.
Choose True or False that best describes each statement.
True | False | |
|---|---|---|
The slope of the equation is (1/4) and the candle grows 1 inch every 4 minutes. | ||
The candle has an initial height of 32 inches before lighting it. | ||
32 minutes after lighting the candle, it will have a height of 0 inches. | ||
The height of the candle is 25 inches exactly 28 minutes after lighting it. |
The table displays values of a linear function.

What is the rate of change of the function?
The table represents the relationship between x and y.
![]()
The direct variation equation of this table is:
The tax on an item directly varies to the price of the item. The total cost of a $4.80 item is $5.04 (tax included).
The equation that models this relationship, where the total cost (tax included) is represented by (y) and the price of the item is represented by (x), is:
The table shows the cost per long distance phone call based on the number of minutes.

Find the rate of change (slope) for the above situation. Write your answer in simpliest form.
The table shows the cost per long distance phone call based on the number of minutes.
Select all that apply.
The cost of entering a carnival and riding rides is given by the linear function:
Where C(r) is the total cost of attending the carnival and r is the number of rides.
The slope of the linear function represents the
Which linear equation represents a line that passes through the point (3,5) and has a y-intercept of -1?
*This graph is the same as #17, use the edit background feature as needed.
Find the equation of the line that goes through the two points on the graph. Be sure to write the equation in slope-intercept form.

Which linear function includes the points
Write an equation that has an x-intercept of 5 and a y-intercept of 8 in slope intercept form.
What is the domain of the graph below?

Riya is selling candles to raise money for the school dance. For each candle she sells, the school well get $2.50. She has 10 candles to sell. Is this situation be continous or discrete? What is the domain?
Given the graph below, find the slope of the line.

Check all that apply to the function graphed below.

Write the equation in slope-intercept form that represents the graph below.

Katie received a $100 Starbucks gift card for her birthday. She purchases a latte everyday for $6.50. Write an equation in slope intercept form that represents the situtation.
Which situation best describes the graph below.
