Unit 6 Test Review
star
star
star
star
star
Last updated over 3 years ago
20 Nsɛmmisa
1
1
1
1
1
1
1

1
1
1
1
1
1
1
1
1
What is the median age for the following data set representing the age of students requesting tickets for a summer band concert? 13 14 15 15 16 16 17 18 18
Mrs. Caldwell wanted to compare the test scores of 2 of her classes. Using the information below, answer each question. (No, these aren't real test scores) Round all answers to the nearest tenth.
1st Block: 92, 85, 43, 100, 65, 78, 88, 92, 75
2nd Block: 86, 63, 95, 75, 92, 81, 87, 86, 95
What is the mean for 1st block?
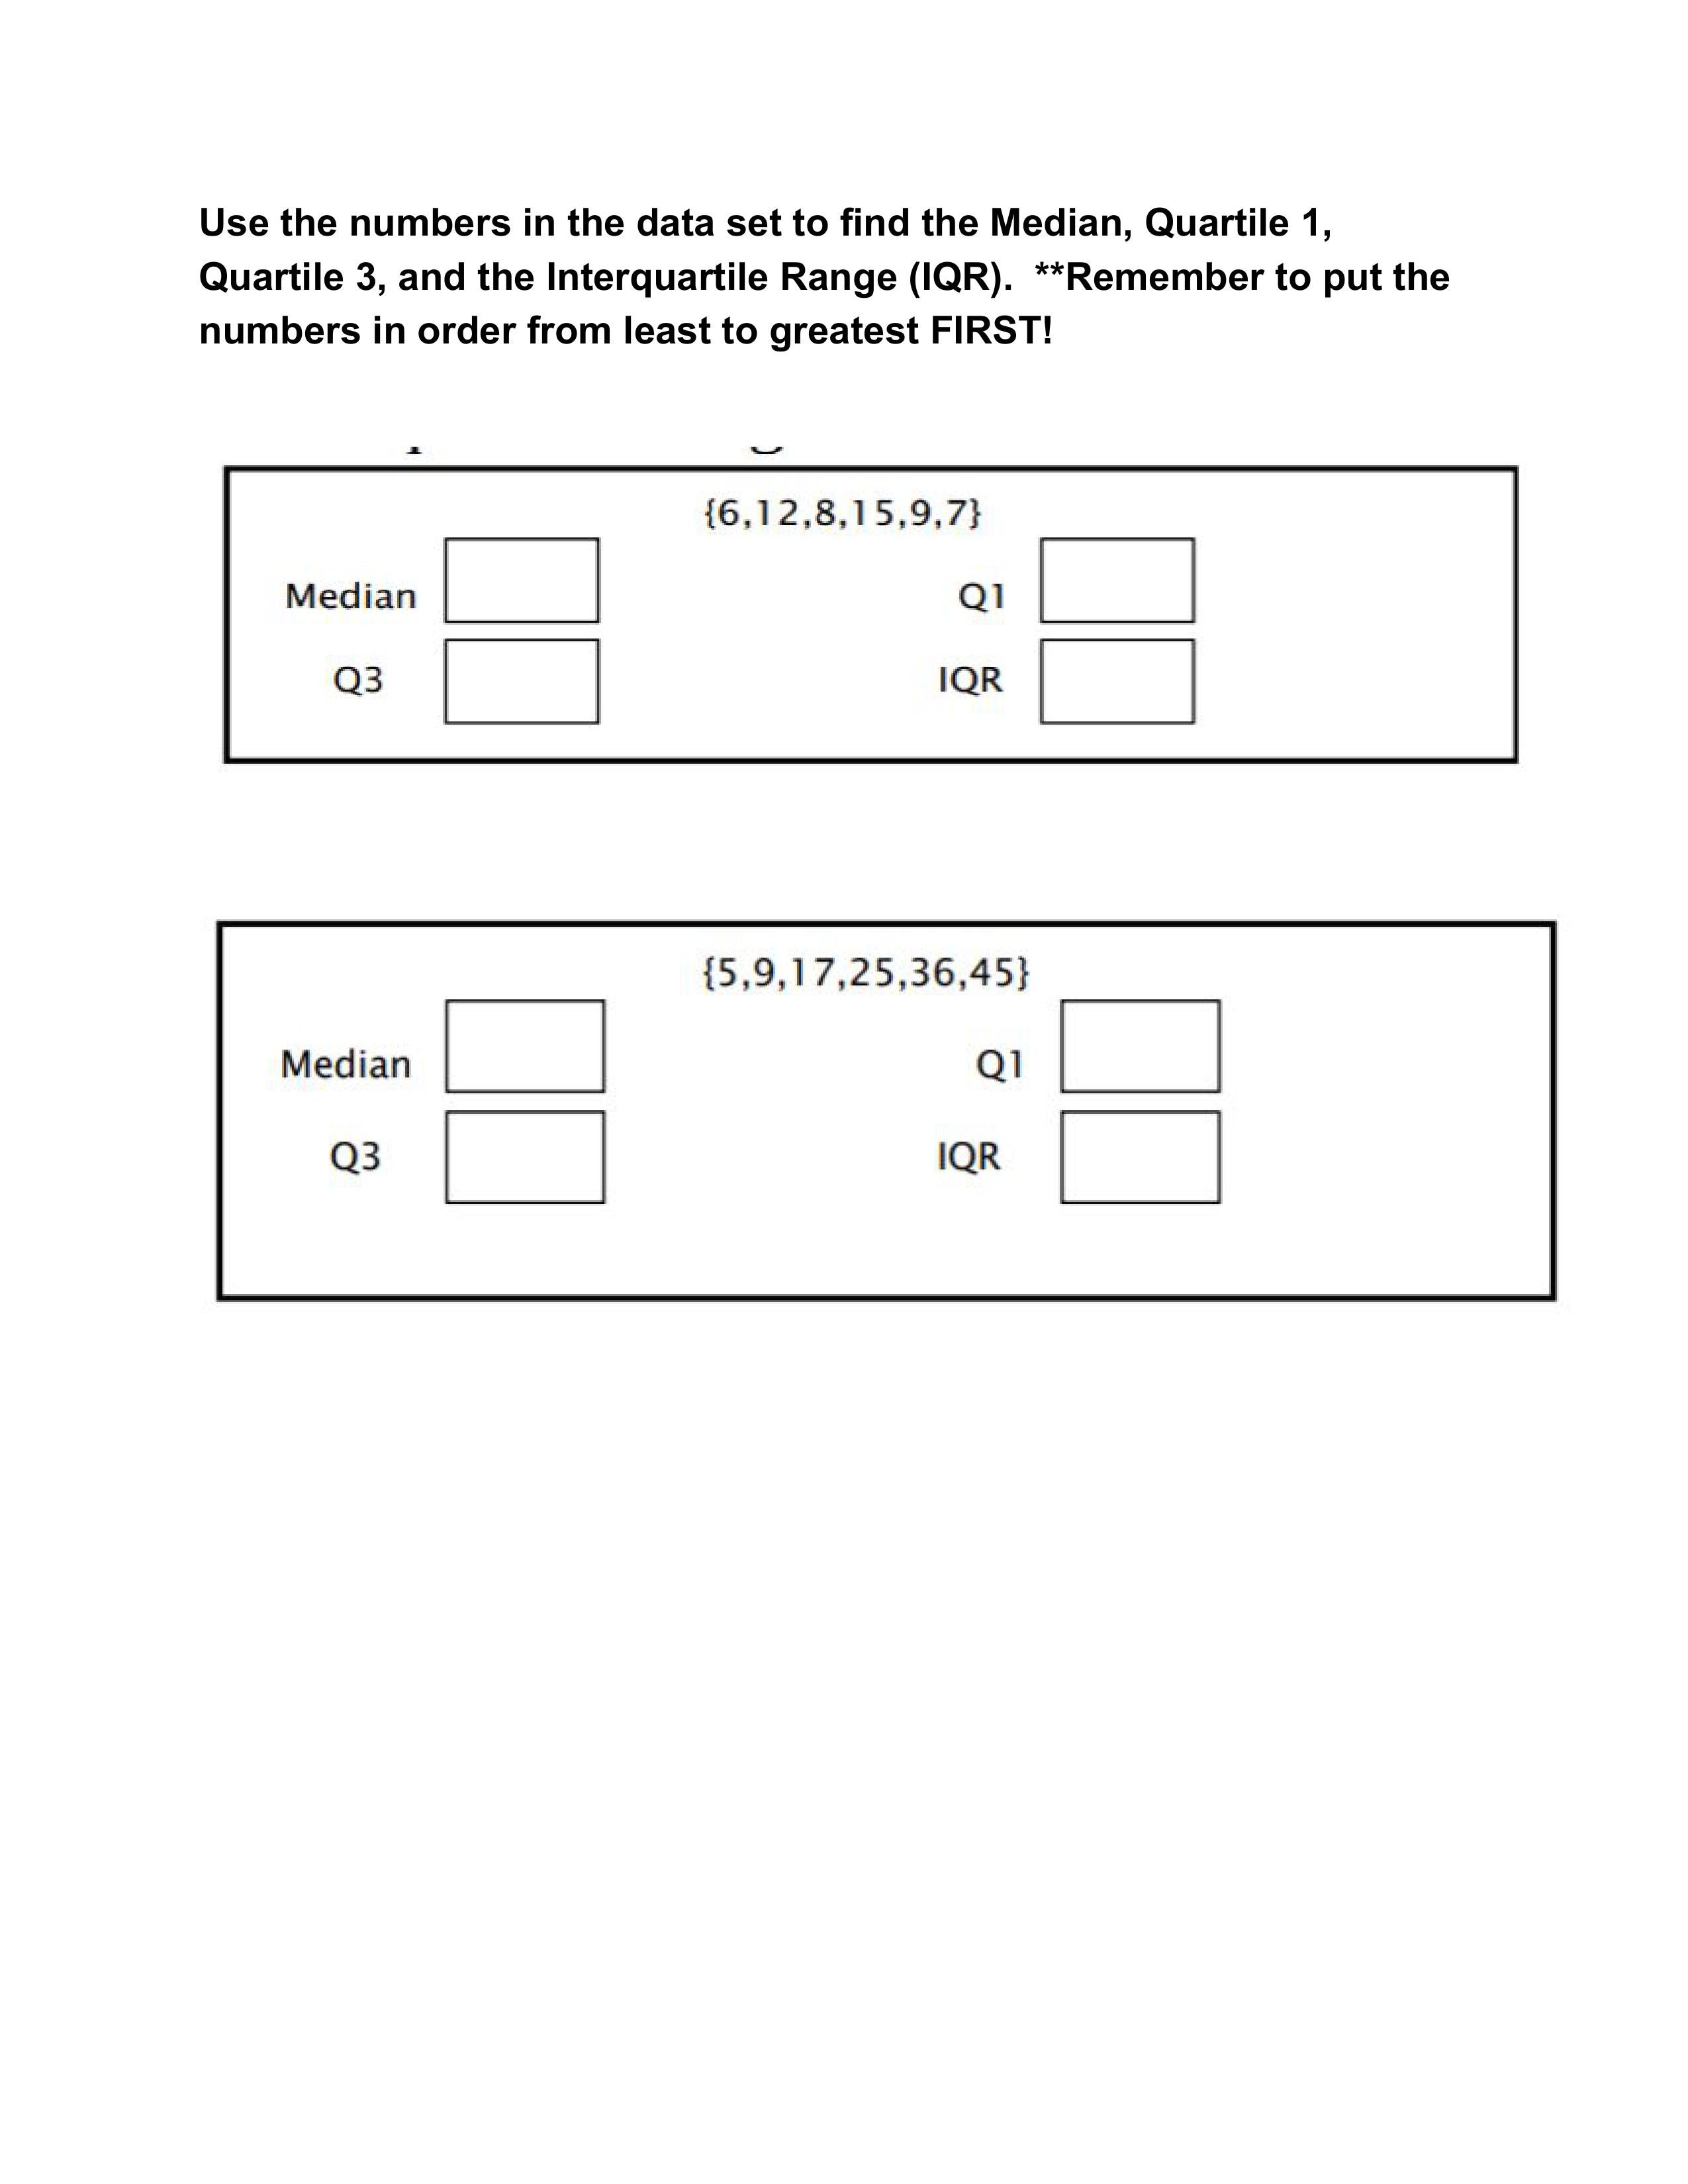
What is the Median?
What is Quartile 1?
What is Quartile 3?
What is the Interquartile Range (IQR)?
Determine the standard deviation to the nearest tenth of a data set of the miles per gallon from the sample of five cars below:
24.9 24.7 24.7 23.4 27.9
Complete the frequency table for the data given.
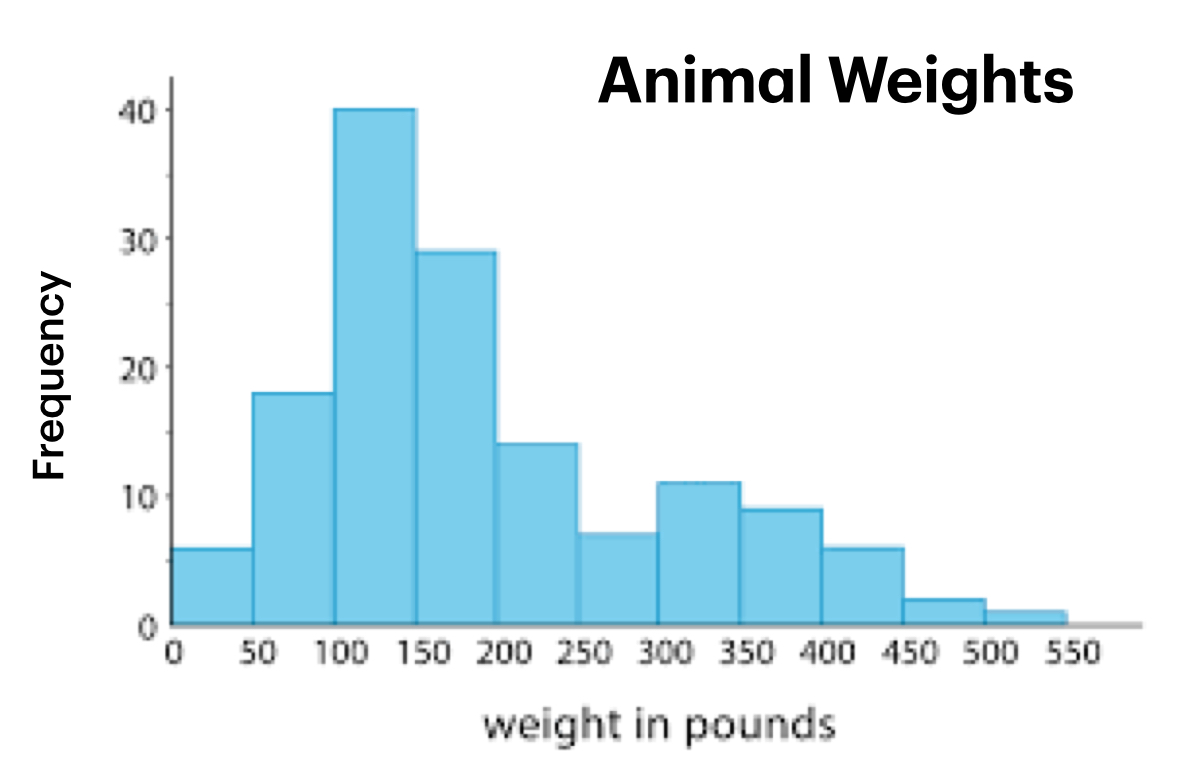
Which question can be answered using the information from this histogram?
Which statement correctly describes the shape of the distribution?
Which statement correctly describes the relationship between the mean and median of this distribution?
Construct a box plot of the data on Hours of TV.
Would you describe this data distribution as approximately symmetric or as skewed?
Gabriella’s quiz grades are shown below. Which is the outlier? 88, 92, 92, 96, 98, 20.
Order the data. Type your answer using commas and no spaces.
What is the 5-number summary for the data? Type your answer using commas and no spaces.
What is the interquartile range (IQR)?
What is the value of the "lower fence"?
What is the value of the "upper fence"?
Are there any outliers? If so, list them. If there are no outliers, answer none.