Measures of Center and Spread Practice cloned 10/3/2022
star
star
star
star
star
Posljednje ažuriranje over 3 years ago
30
1
1
1
1
1
1
1
1
1

1
1
1
1
1
1
1
1
1
1
1
1
1
Find the mean of this data set:
5, 3, 2, 6, 5, 2, 5
Find the median of this data set:
24, 12, 10, 15, 10, 22, 12
What is the Mode?
Mrs. Mullen wanted to compare the test scores of 2 of her classes. Using the information below, answer each question. (No, these aren't real test scores) Round all answers to the nearest tenth.
1st Block: 92, 85, 43, 100, 65, 78, 88, 92, 75
2nd Block: 86, 63, 95, 75, 92, 81, 87, 86, 95
What is the mean for 1st block?
What is the mean for 2nd block?
Which class has the greater mean?
Which class has the greater median?
The Celtics played 5 games over the past two weeks. Here are their points scored: 92, 124, 97, 117, 105. What is the mean of the points they scored over the past five games?
Marina earned $5 on Monday, $10 on Tuesday, $5 on Wednesday, $5 on Thursday, and $20 on Friday. What is the mean of the money she earned during the week?
What is the median of the data given in the table above?
Use the following information for questions 12-14:
Seven baseball players are trying out for a team and the coach wants to see who can throw a baseball the farthest. The distance each player threw the baseball is recorded in the list below:
74 yards, 88 yards, 94 yards, 80 yards, 95 yards, 102 yards, 91 yards
Determine the median distance for the 7 throws, to the nearest yard.
Determine the mean distance for the 7 throws, to the nearest yard.
The coach allowed two additional players to try out for the team, and each player threw the ball a distance of 91 yards. Will these two additional distances have a greater effect on the median or mean distance you calculated?
Two classes are competing in a challenge to collect 75 items for a local food bank. Items are only collected during school days. At the end of the first week, they created the table below to show the number of items collected each day. They also calculated the mean number of items each class collected per day.

If, each day next week, each class collects the mean number of items it collected during week one, which class will win the challenge?
Determine the standard deviation to the nearest tenth of a data set of the miles per gallon from the sample of five cars below:
24.9 24.7 24.7 23.4 27.9
The table shows the percentage change in a factory production over 9 months.Calculate the interquartile range of the given data.

Listed below are the life expectancies (in years) of men in 28 countries. Use this data to answer questions 11-16

What is the minimum value?
What is the maximum value?
What is the range of life expectancies?
What is the median value?
What percent of the population is represented by the upper quartile?
What is the interquartile range?
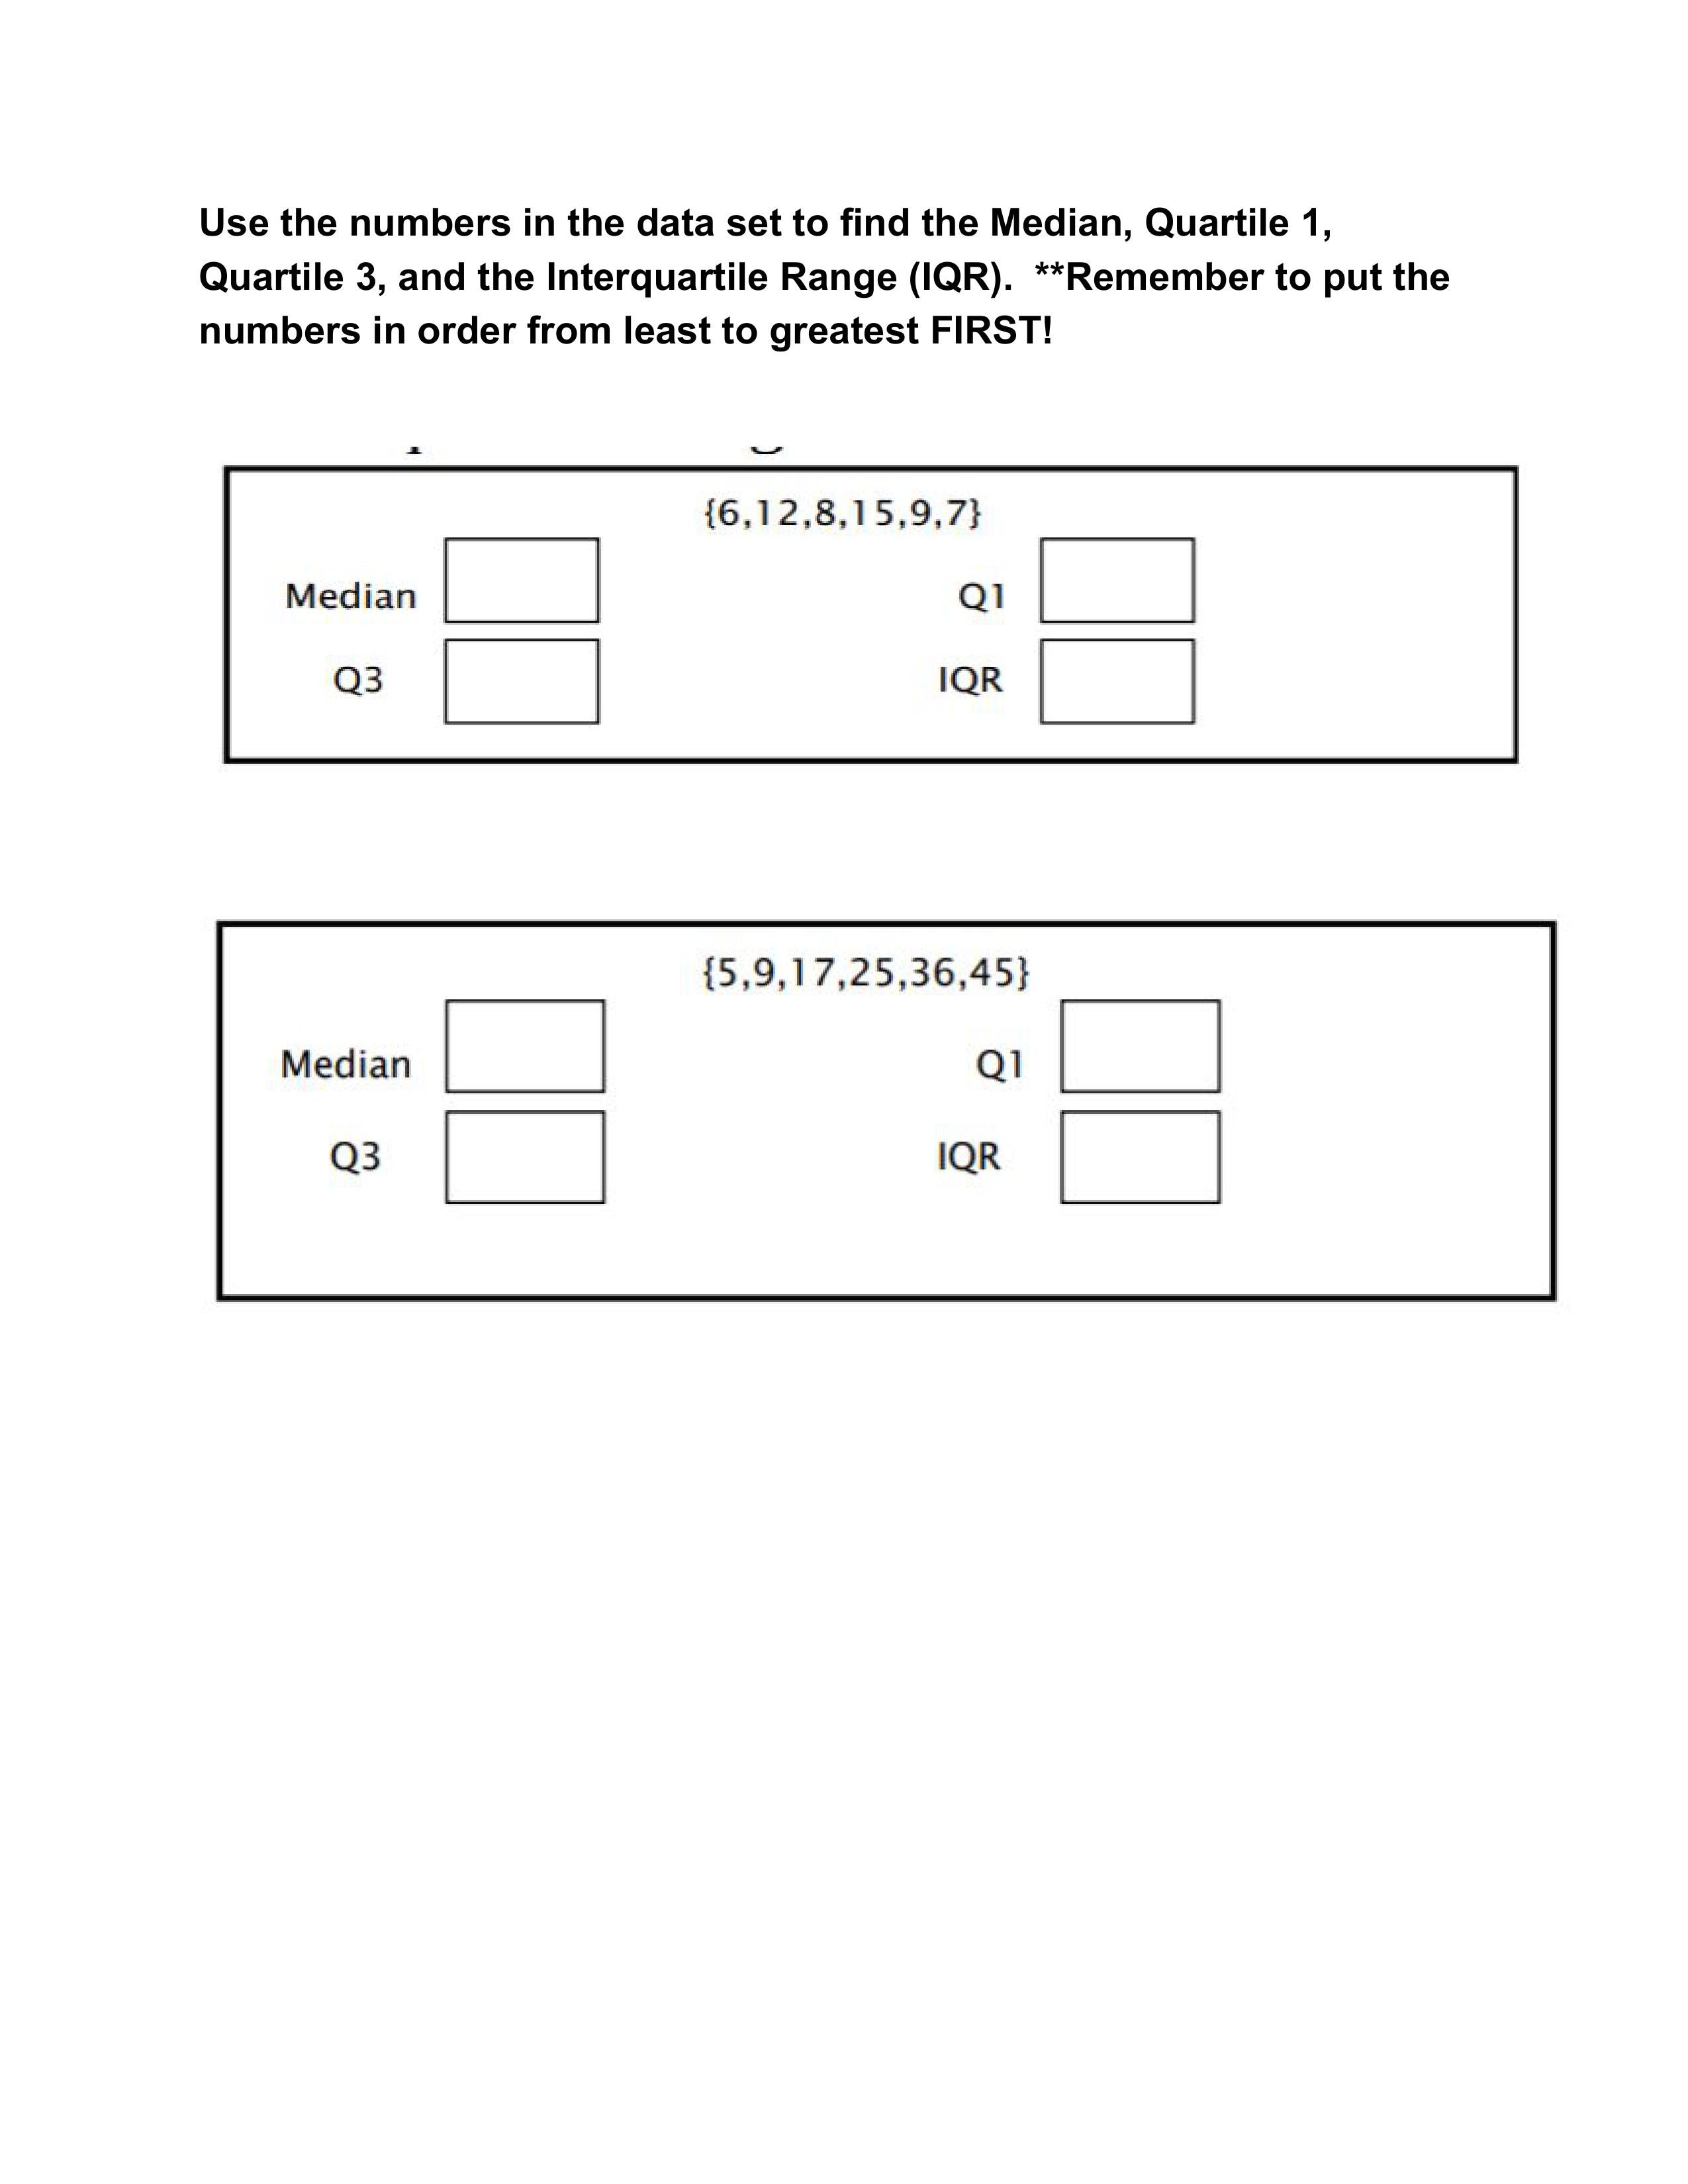
What is the Median?
What is Quartile 1?
What is Quartile 3?
What is the Interquartile Range (IQR)?
What is the Median?
What is Quartile 1?
What is Quartile 3?
What is the Interquartile Range (IQR)?