1
1
1
1
1
1
1
1
Determine the standard deviation to the nearest tenth of a data set of the miles per gallon from the sample of five cars below:
24.9 24.7 24.7 23.4 27.9
The table shows the percentage change in a factory production over 9 months.Calculate the interquartile range of the given data.

Listed below are the life expectancies (in years) of men in 28 countries. Use this data to answer questions 11-16

What is the minimum value?
What is the maximum value?
What is the range of life expectancies?
What is the median value?
What percent of the population is represented by the upper quartile?
What is the interquartile range?
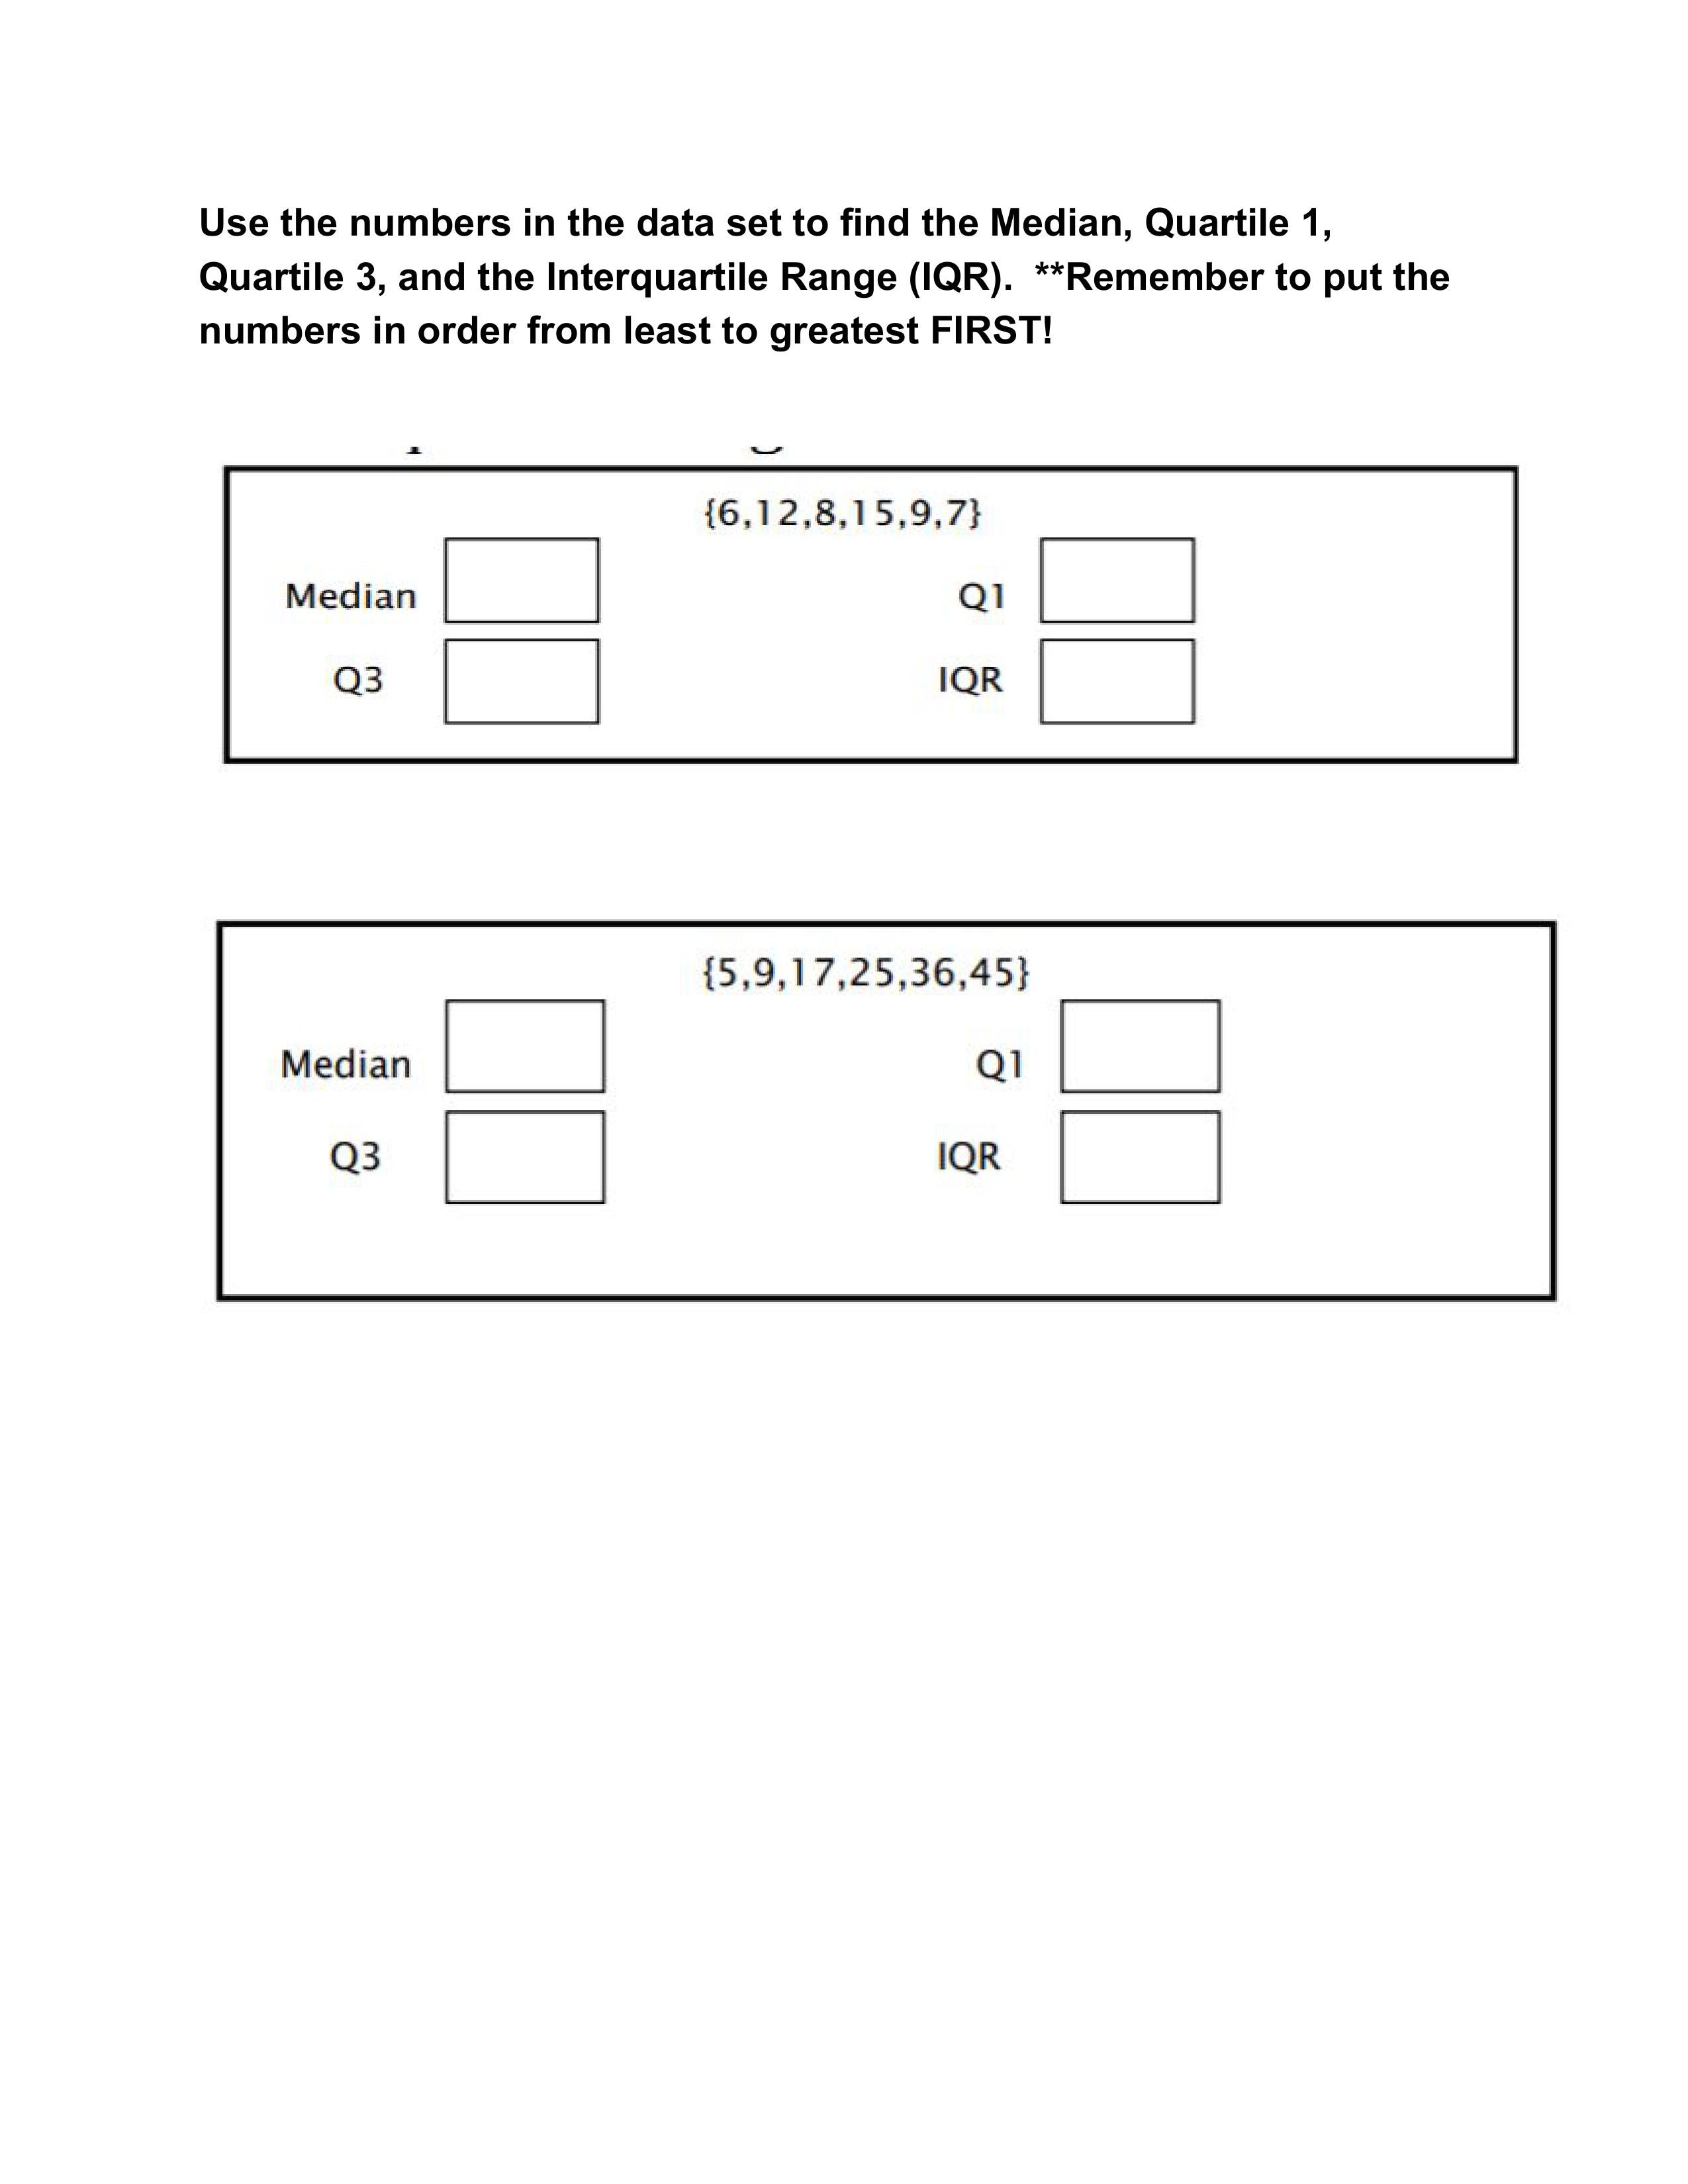
What is the Median?
What is Quartile 1?
What is Quartile 3?
What is the Interquartile Range (IQR)?
What is the Median?
What is Quartile 1?
What is Quartile 3?
What is the Interquartile Range (IQR)?