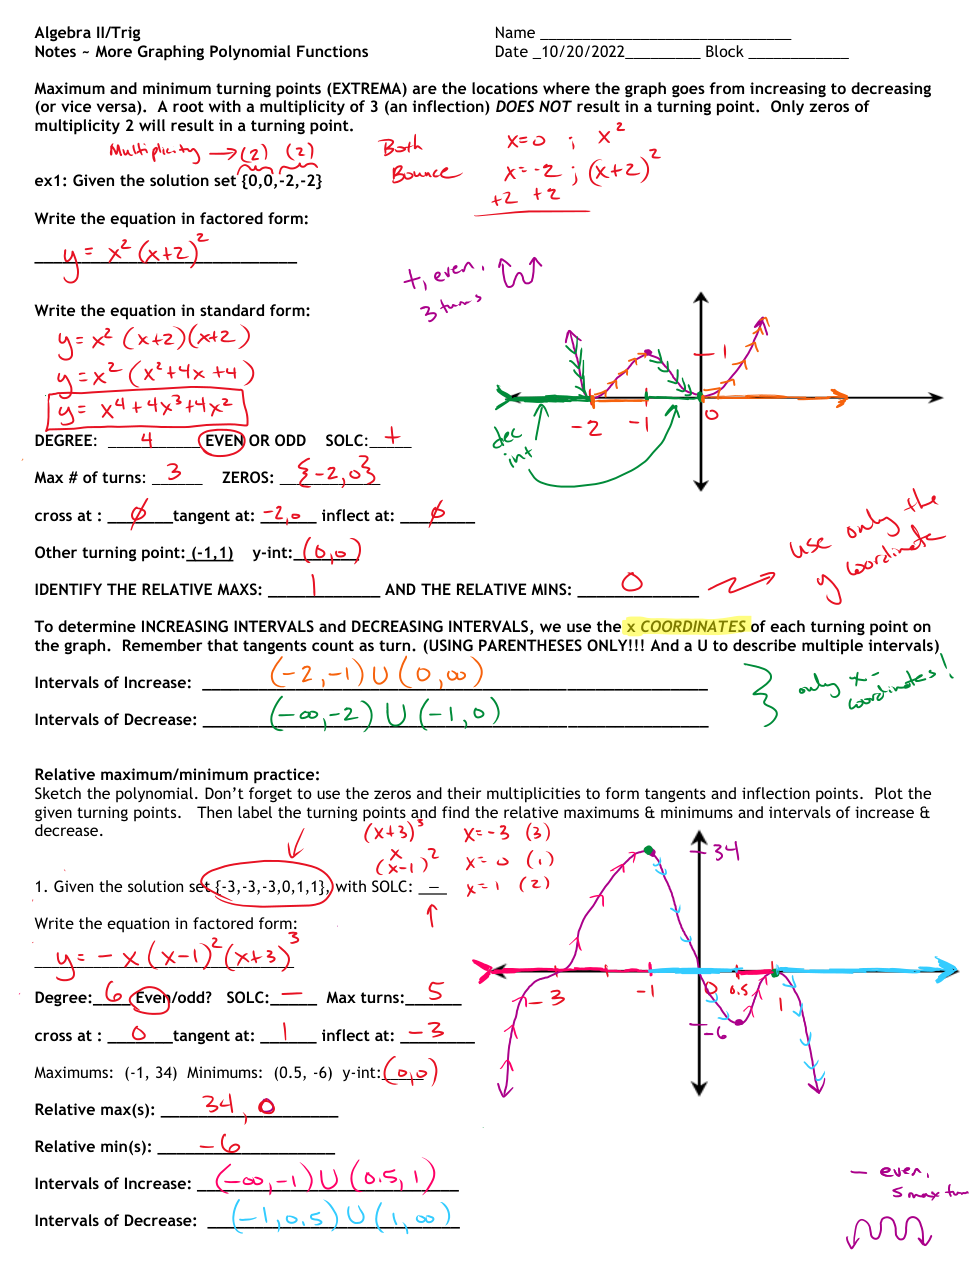
Given the solution set: {0, -3, -3, -3},
What is the factored form of the equation? (use f(x)= in your answer)
Given the solution set: {0, -3, -3, -3},
Use your answer from the last question to graph this function, using the following additional relative max/min:
Min: (-1.2, -8.4)
Feel free to upload your hand-drawn graph from the previous question here:
Given the function:
What is the factored form of the equation (be sure to change the exponent on the binomial if necessary)? (use f(x)= in your answer)
Given the function:
Use your answer from the last question to graph this function, using the following additional relative max/min:
Max: (0.6, 4.3)
Min: (-1.4, -33)
Feel free to upload your hand-drawn graph from the previous question here:
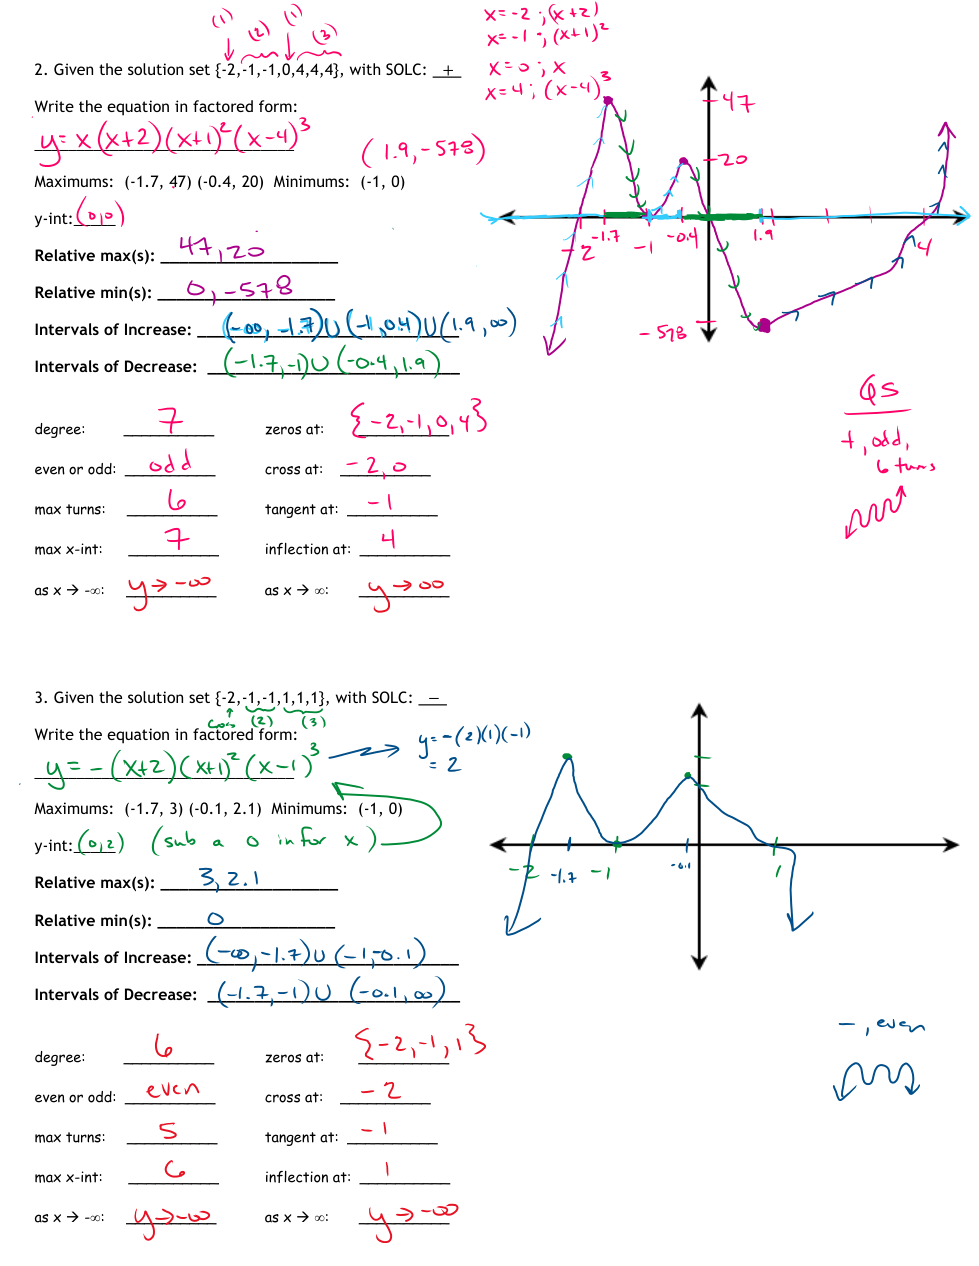
Given the function:
What is the factored form of the equation (completly factor the binomial and trinomial to get your answer)? (use f(x)= in your answer)
Given the function:
Use your answer from the last question to graph this function, using the following relative max/min:
Max: (0, 378)
Min: (-4.7, -200)
Min: (5.4, -367.7)
Feel free to upload your hand-drawn graph from the previous question here:
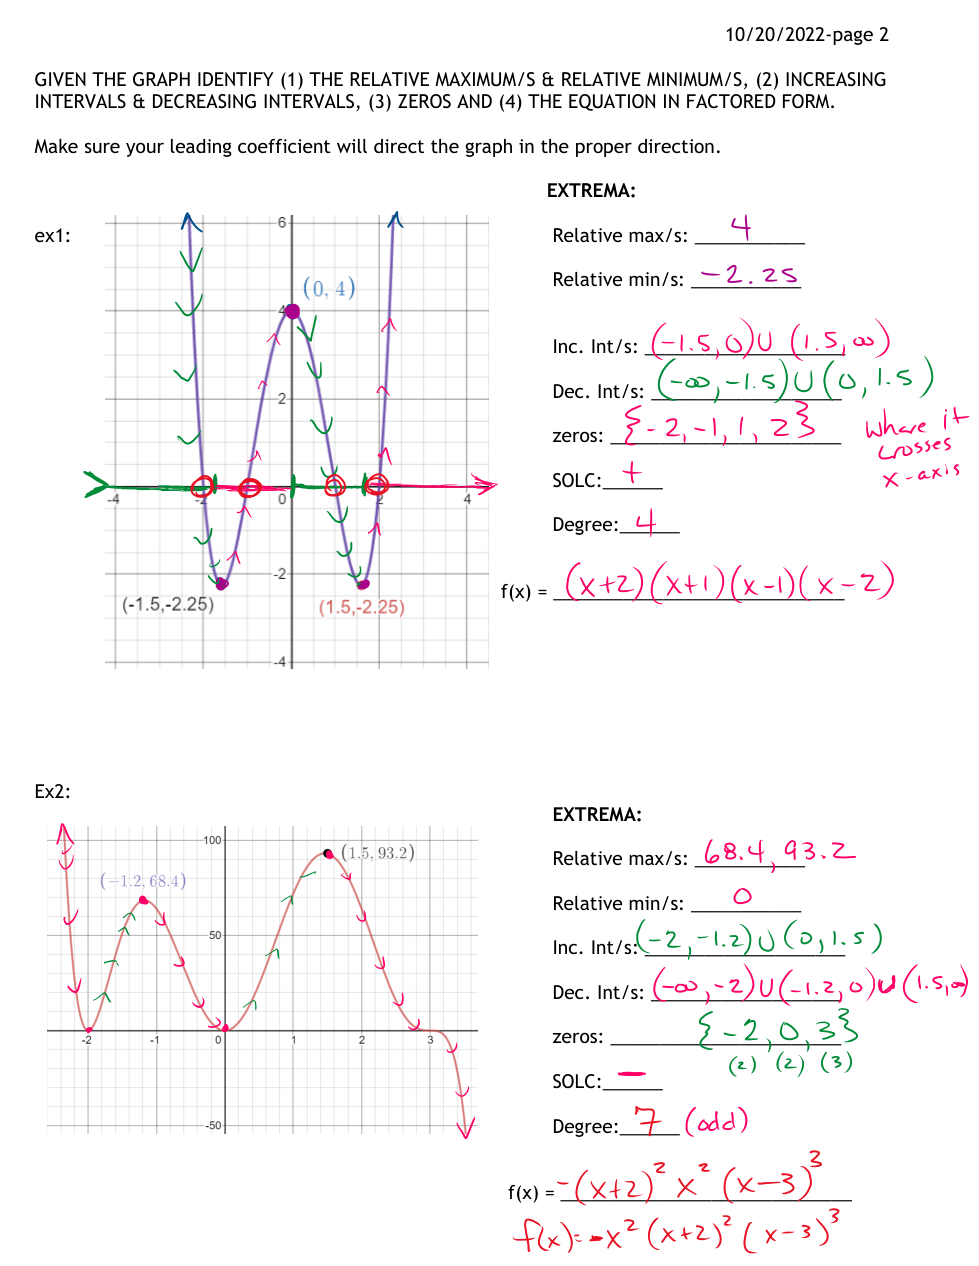
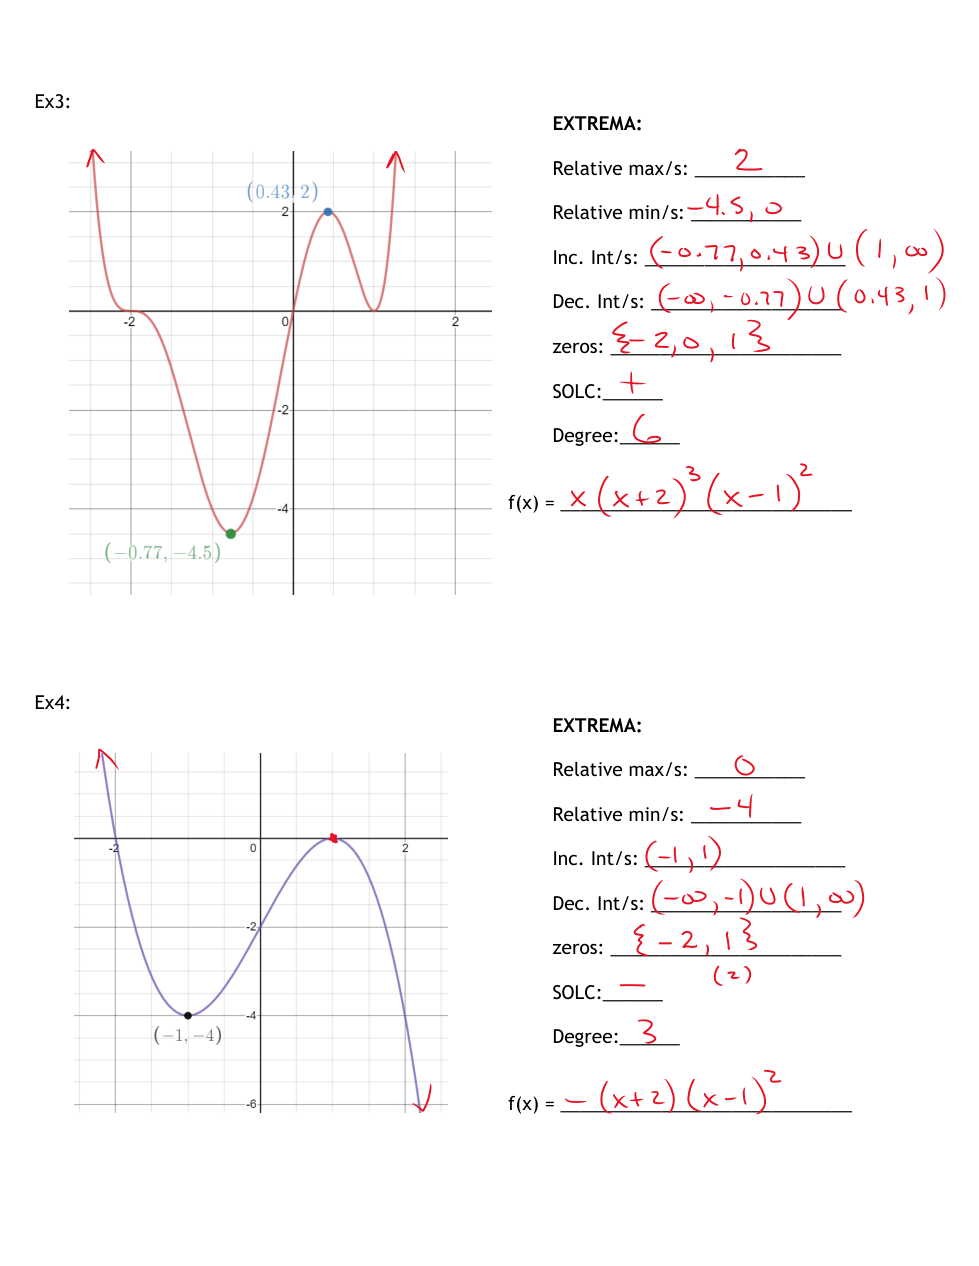
Given the graph: What are the relative maximum(s)? (include ONLY the y coordinate, not the point)
Given the graph: What are the relative minimum(s)? (include ONLY the y coordinate, not the point..separate with a comma, no spaces)
Given the graph: What are the increasing interval(s)? (in order from low to high, separate with a union U, no spaces)
Given the graph: What are the decreasing interval(s)? (in order from low to high, separate with a union U, no spaces)
Given the graph: Write the equation in factored form. (include appropriate multiplicity and y= )
Given the graph, what is the relative maximum? (include ONLY the y coordinate, not the point)
Given the graph, what is the relative mimimum? (include ONLY the y coordinate, not the point)
Given the graph, what are the increasing interval(s)? (same as before for input)
Given the graph, what are the decreasing interval(s)? (same as before for input)
Given the graph, write the equation in factored form: (include y= in your answer)
Given the graph, write the equation in standard form: (distribute/expand your result from the last question) (include y= in your answer)
Factor completely: (look for GCFs)
Factor completely: (look for GCFs)
Factor completely: (look for GCFs)
(careful! that a value is NOT 1...you need to be sure to box it up!)
Factor completely: (look for GCFs)
Factor completely: (look for GCFs)
upload your pages of work here--page 1
upload your pages of work here--page 2
upload your pages of work here--page 3


