Obavezno
1
7.4.A
Obavezno
1
7.4.C
Obavezno
1
7.4.A
Obavezno
1
7.4.A

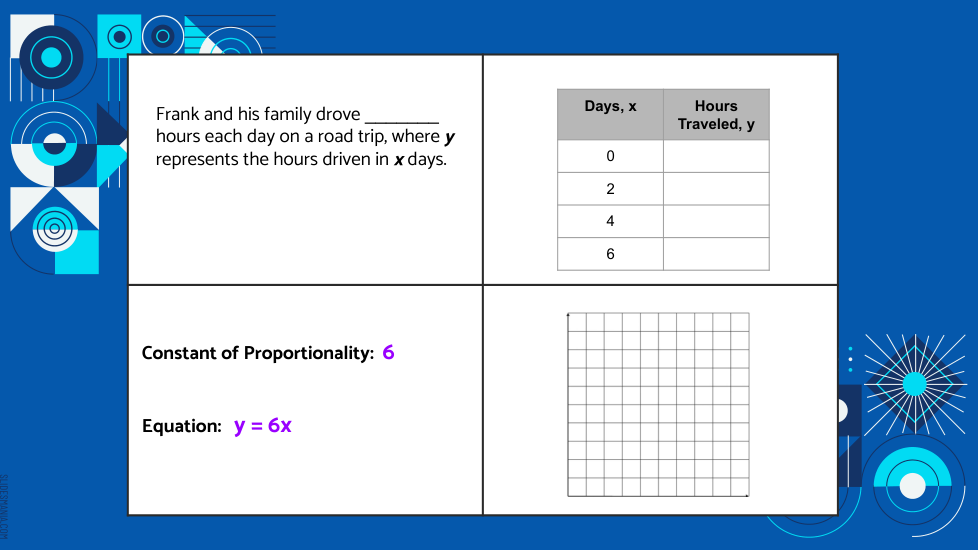
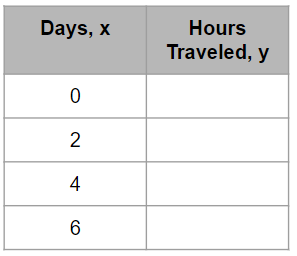
Use the information given to determine how many hours Frank and his family drove each day.
What is the constant of proportionality?
Which equation can be used to represent this relationship?
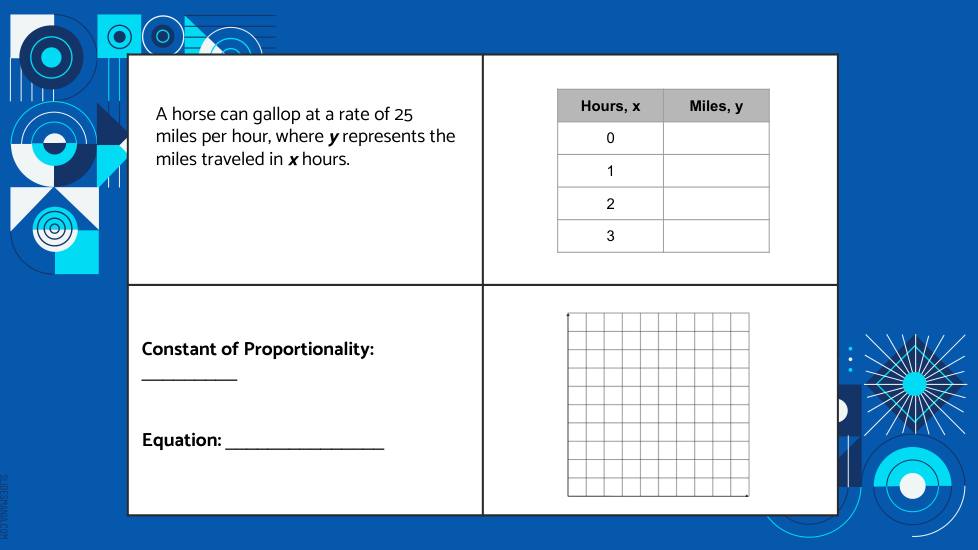
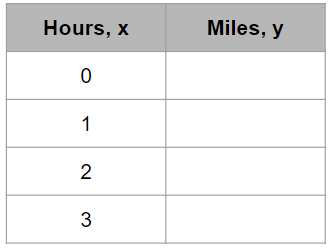
Show 3 points on the graph that represent the relationship.
Use the information given to determine how much Michael charges per hour.
What is the constant of proportionality?
Which equation can be used to represent this relationship?
Show 3 points on the graph that represent the relationship.
Show 3 points on the graph that represent the relationship.
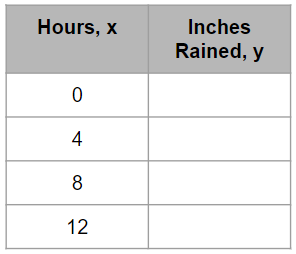
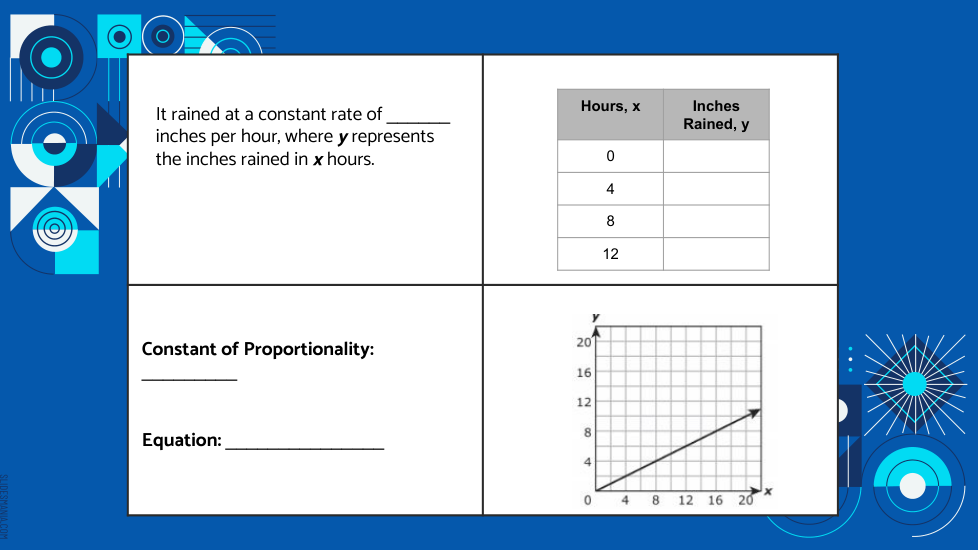
Use the information given to determine how many inches it rained per hour.
What is the constant of proportionality?
Which equation can be used to represent this relationship?