Source: https://ourworldindata.org/global-economic-inequality
Living conditions are vastly unequal between different places in our world today. This is largely the consequence of the changes in the last two centuries.
Our individual stories play out amidst these major global changes and inequalities and it is these circumstances that largely determine how healthy, wealthy, and educated each of us will be in our own lives. Yes, our own hard work and life choices matter. But as we will see in the data, these matter much less than the one big thing over which we have no control: where and when we are born. This single, utterly random, factor largely determines the conditions in which we live our lives. Today’s global inequality is the consequence of two centuries of unequal progress. Some places have seen dramatic improvements, while others have not.
Living conditions are vastly
Today's inequality is largely the result of changes that have taken place around the world in the last 200 years.
Somalia has the highest % of children who die before they reach the age of 5.
The average person in Sierra Leone lives longer than the average person in Japan.
The average adult around the world has attended school for just over 8 years.
The average child is expected to attend school for more years than the average adult has.
The average income in the Central African Republic is $6,670.
The average person in the year 1800 was expected to live longer than the average person in the year 2017.
The average person in the year 1800 went to about 7 years of school.
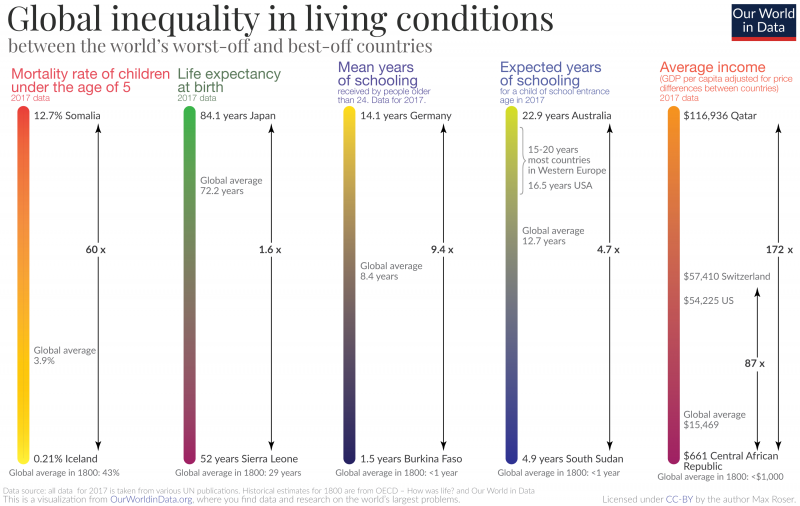
The visualization above shows the inequality in living conditions between the worst and best-off countries in the world today in a number of aspects:
Health: A child born in one of the countries with the worst health is 60-times more likely to die than a child born in a country with the best health. In several African countries more than one out of ten children born today will die before they are five years old. In the healthiest countries of the world – in Europe and East Asia – only 1 in 250 children will die before he or she is 5 years old.
Education: In the countries where people have the best access to education – in Europe and North America – children of school entrance age today can expect 15 to 20 years of formal education. In Australia, which is an outlier, school life expectancy is 22.9 years. Children entering school at the same time in countries with the poorest access to education can only expect 5 years. And additionally, children tend to learn much less in schools in poorer countries.
Income: If you look at average incomes and compare the richest country – Qatar with a GDP per capita of almost $117,000 – to the poorest country in the world – the Central African Republic at $661 – then you find a 177-fold difference. This is taking into account price differences between countries and therefore expressed in international-$. Qatar and other very resource-rich economies might be considered outliers here, suggesting that it is more appropriate to compare countries that are very rich without relying mostly on exports of natural resources. The US has a GDP per capita of int.-$54,225 and Switzerland of 57,410 international-$. This means the Swiss can spend in 1 month what people in the Central African Republic can spend in 7 years.
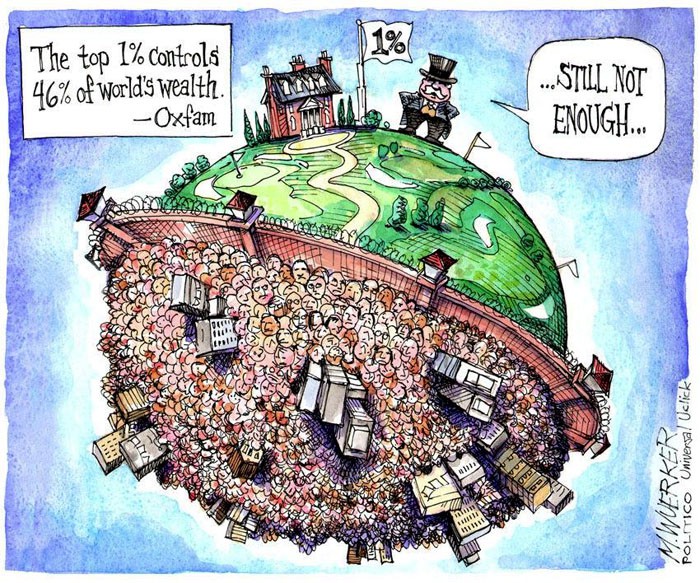
Describe what you see in this political cartoon.
What message do you think the artist is trying to send in this political cartoon?
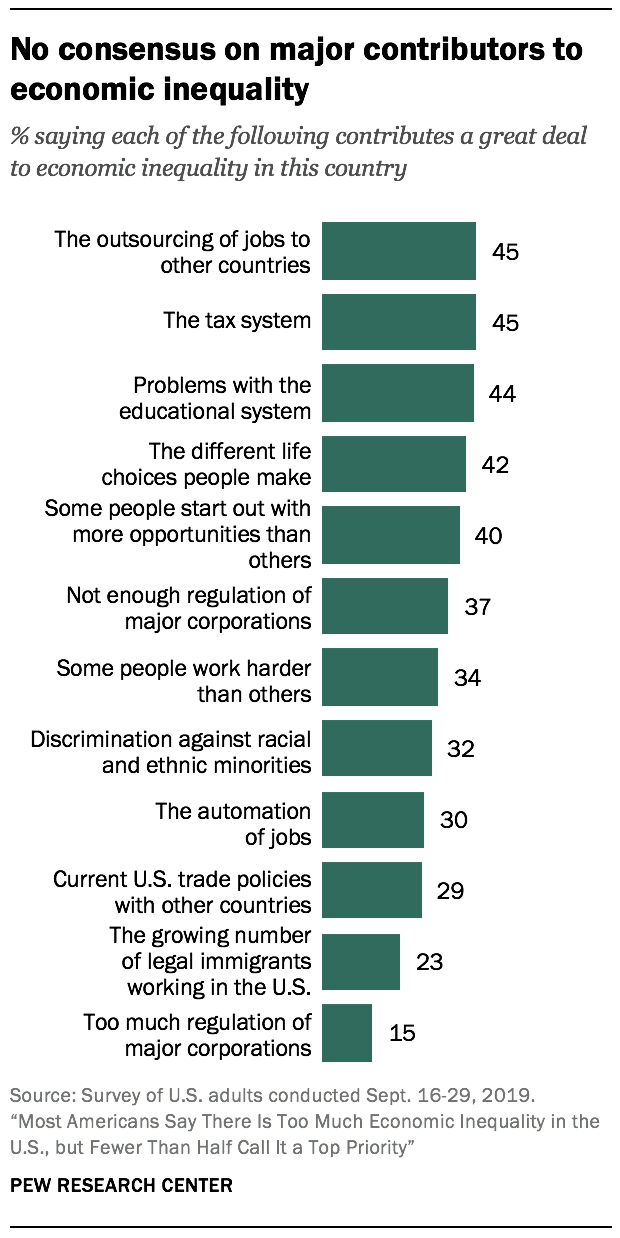
The Pew Research Center polled a number of Americans to find out why they think there is so much inequality in the U.S. Look at the responses that were given and comment on three different responses.
Your comments can be statements of agreement, disagreement, questioning, etc...Be sure to also explain the reason behind your statement (ex: "I agree with ___________ because _____________."
NOT just "I agree with _______.")
According to the author of this article, what factor matters most when it comes to how healthy, wealthy, and educated each of us will be in our lives?
Do you agree with the author? Why or why not?
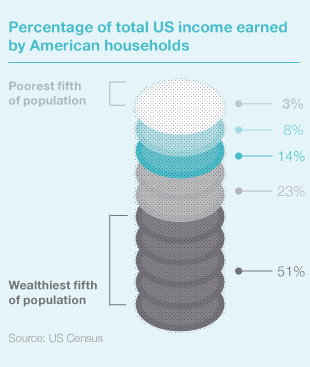
The current U.S. population is about 330,000,000. Each color on the visual to the left represents 1/5 of the U.S. population. How much is 1/5 of the U.S. population?
What do the %s (ex: 3%, 8%, 14%, etc...) to the right of the visual represent?
What % of all income in the U.S. goes to the wealthiest 1/5 of the population?
What % of all income in the U.S. goes to the poorest 1/5 of the population?