Log in
Sign up for FREE
arrow_back
Library

Station 2 - AAC

star
star
star
star
star
Last updated over 3 years ago
13 questions
Required
1
Required
0
Required
1
1
Required
1
Required
1
Required
1
Required
1
Required
1
Required
1
Required
1
Required
1
Required
1
Question 12
12.

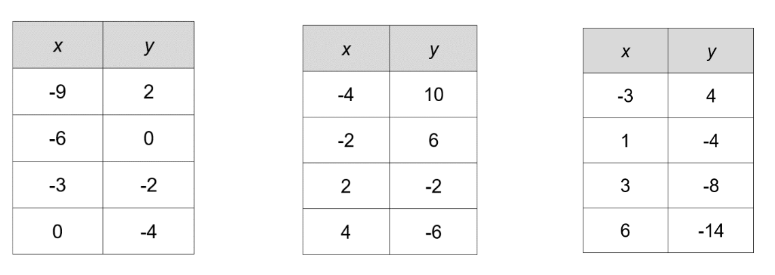
Click on all of the tables that has a slope of - 2

Question 13
13.

Question 1
1.
Slope(m): _______
What does slope mean? (Use units) _______

Y-intercept: (0, _______)
What does the y-intercept mean? (use units) _______

Equation: _______

After 6 1/2 years, how tall is the tree? _______
Question 2
2.

Question 3
3.

Question 4
4.

Graph the first two points from the table.

  • Click a Graph tab (Graph 1, Graph 2, and so on) for each graph you need to plot.
  • Click on the graph background to add a point. Add two points to create a graph. Drag a point or type in x and y coordinates to edit its position. Click on a point to delete it.
  • After creating your graph, you can check the dashed line box.
Question 5
5.

Question 6
6.

Represent this linear function as an equation in slope-intercept form:
y = mx + b
(NO SPACES)

Question 7
7.

Question 8
8.

Question 9
9.

Graph the y intercept and the point where x = 4.

  • Click a Graph tab (Graph 1, Graph 2, and so on) for each graph you need to plot.
  • Click on the graph background to add a point. Add two points to create a graph. Drag a point or type in x and y coordinates to edit its position. Click on a point to delete it.
  • After creating your graph, you can check the dashed line box.
Question 10
10.

Question 11
11.

Represent this linear function as an equation in slope-intercept form.
y = mx + b
(NO SPACES)

The table shows the linear relationship between the number of hours Linda worked, x, and the amount of money Linda earned, y.


Based on the table, how much did Linda earn per hour?
$42.50 per hour
$17 per hour
$38.25 per hour
$29.75 per hour
What is the rate of change?
3
3/2
2
2/3
What is the y-intercept?
(0, 1)
(0, 2)
(-4, -5)
(-2, 0)
Which statement is true?
The table represents a linear, non-proportional relationship because it has a constant rate of change.
The table represents a linear, non-proportional relationship because the y-intercept is not the origin.
The table represents a linear, proportional relationship because it has a positive y-intercept.
The table represents a linear, proportional relationship because it has a constant rate of change.
What is the slope?
-3
-3/4
-4/3
-3/2
What is the y-intercept?
(0, 2)
(0, 0)
(-2, 0)
(-4, 3)
Which statement is true?
The table represents a linear, proportional relationship because it has a positive rate of change.
The table represents a linear, non-proportional relationship because it has a negative slope.
The table represents a linear, proportional relationship because the y-intercept is the origin.
The table represents a linear, non-proportional relationship because the y-intercept is a negative number.