(U2) Lesson 6 - Getting down to business
star
star
star
star
star
Last updated over 2 years ago
8 questions
Today's Learning Goal:
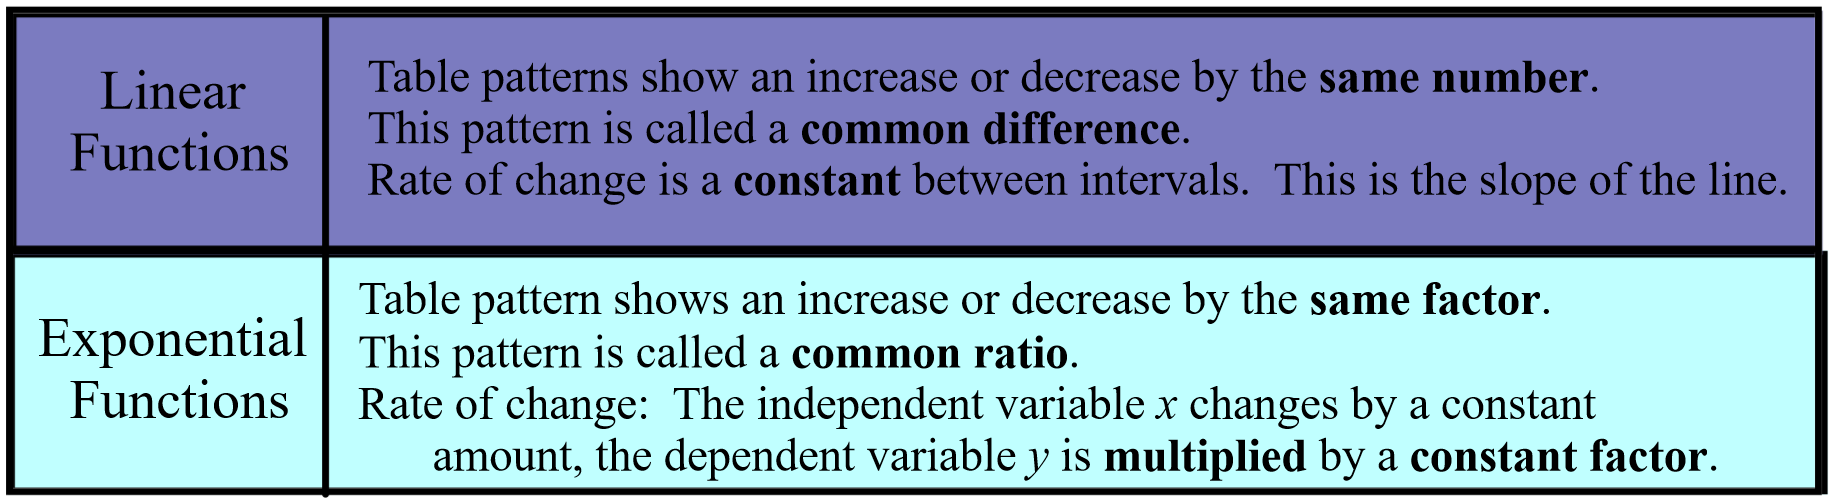
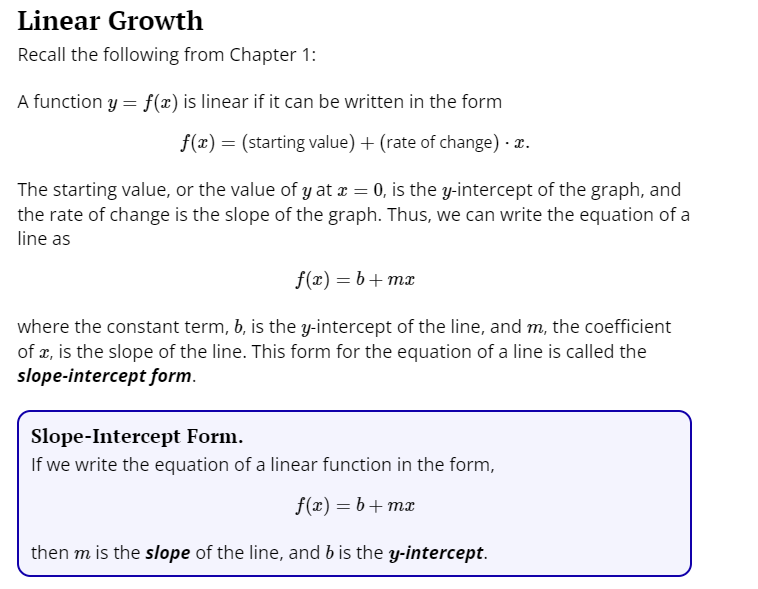
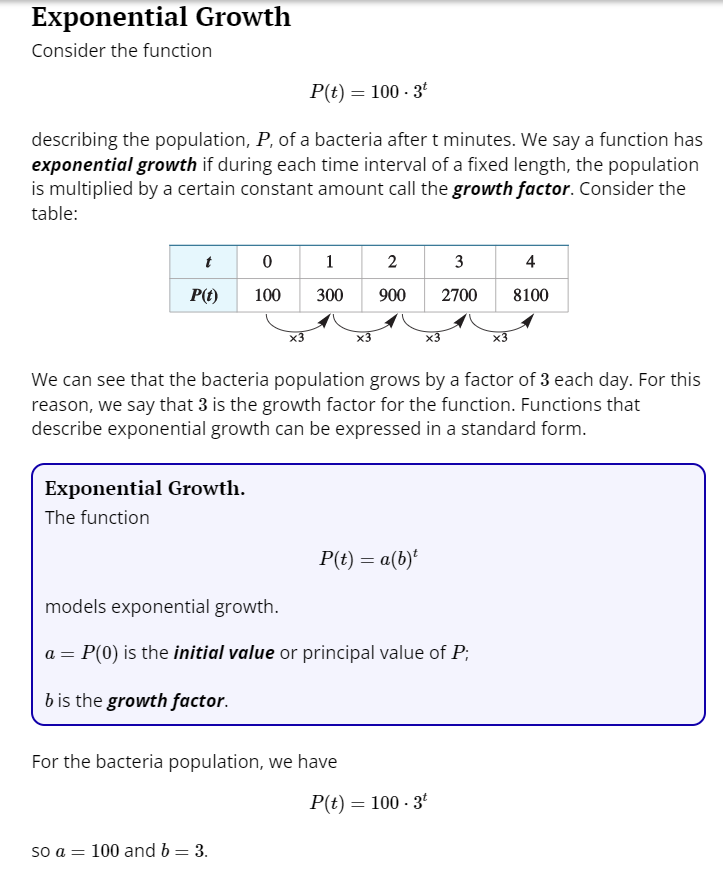
- Model both linear and exponential functions with tables, graphs and equations.
- Compare the end behavior of linear and exponential functions and make arguments about why exponential functions eventually exceed linear functions.
- Make modeling decisions about whether a discrete or continuous model is more appropriate.
- Interpret the point of intersection of two functions as the value that occurs when f(x) = g(x).
Reminders:
Discrete functions have distinct and separate values and are used for things that can be counted. (countable)
Continuous functions can have any value within a specific interval and values are connected. (measureable)
Domain of a function: The numbers that can be used as possible inputs
Today's Materials:
- Laptop
- Pencil
- Binder
Please complete the Jump Start (activator). This is independent it should be silent.
Practice
Learning Focus:
- Make modeling decisions about business plans.
- Interpret mathematical models to make business decisions.
- Determine which type of function grows faster and make arguments about why.
Which type of function increases faster—linear or exponential? Which model is best for a given situation, discrete or continuous?
How can mathematical models help to make business decisions?
Required
1
Click the parts of the text that are most important mathematically.
Calcu-rama had a net income of $5 million in 2020, while a small competing company, Computafest, had a net income of $2 million.
The management of Calcu-rama develops a business plan for future growth that projects an increase in net income of $0.5 million per year, while the management of Computafest develops a plan aimed at increasing its net income by 15% each year.
Required
0
Create standard mathematical models (table, graph, and equations) for the projected net income over time for both companies.
Required
4
Compare the two companies:Categorize the facts about each company based on the representations.
Compare the two companies:
Categorize the facts about each company based on the representations.
- Graphs: Exponential Curve: Increases slowly in the first few years and then rises quickly.
- Graphs: Straight line - Constant increase each year.
- Tables: Increases at a constant rate of 0.5
- Function Type: Exponential
- Equations: 0.5 is the slope (Common difference),Y-intercept is 5 (Starting value)
- Equations: The constant ratio of 1.15 is the base of the exponential.The initial value of 2 is multiplied.
- Tables: Increases at 15% per year, making a constant ratio of 1.15.
- Function Type: Linear
- Calcu-rama
- Computafest
Required
0
If both companies were able to meet their net income growth goals, which company would you choose to invest in? Why?
Required
1
Which company would make most money after 8 years?
Required
1
When would your projections suggest that the two companies have the same net income? How did you find this? Will they ever have the same net income again?
Required
1
Which company would make most money after 14 years?
Required
0
Why did we model as discrete or continuous? Explain.