Mastery check for Data Analysis
star
star
star
star
star
Posljednje ažuriranje over 3 years ago
12
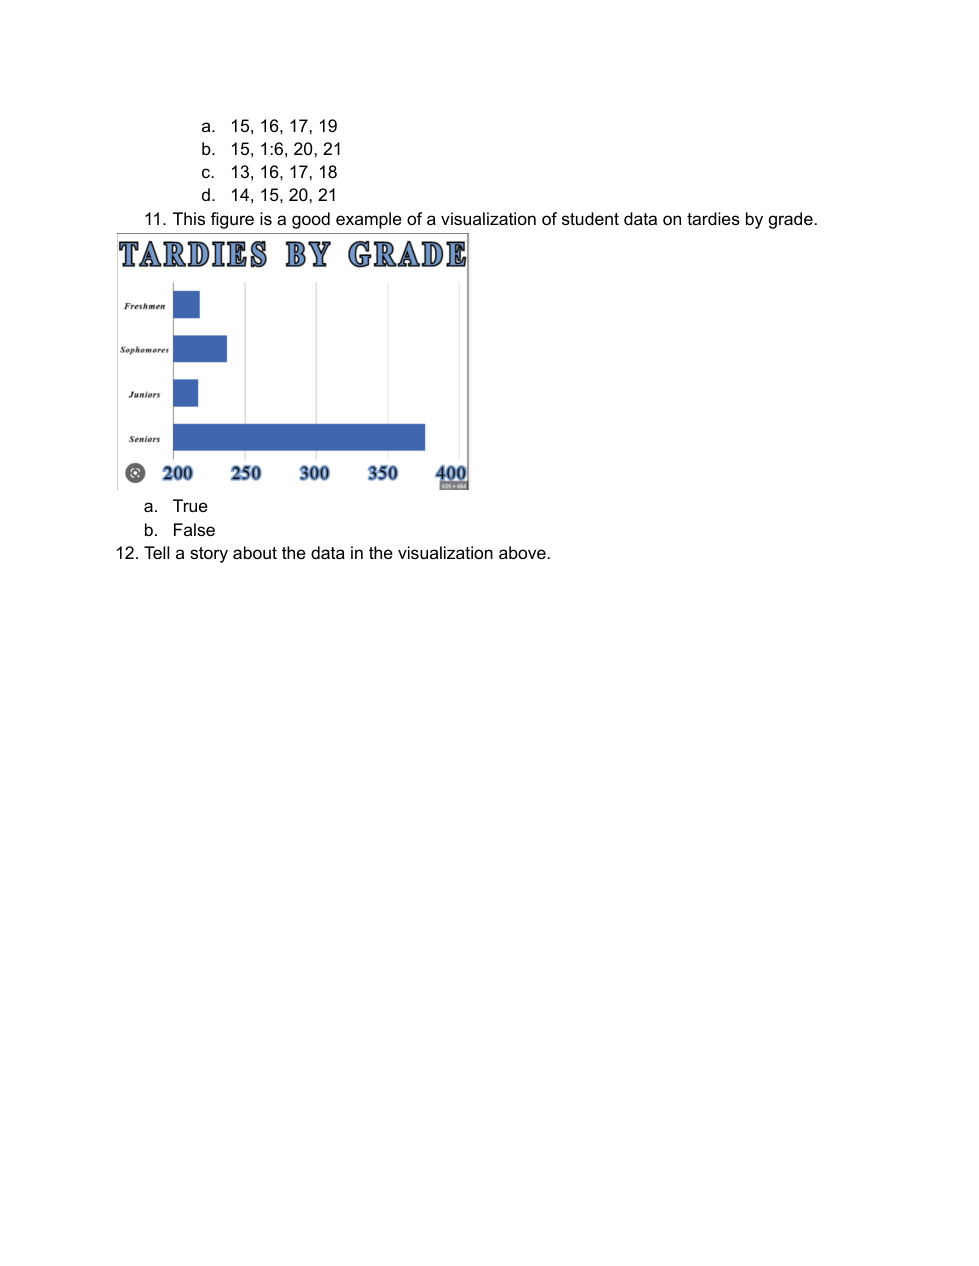
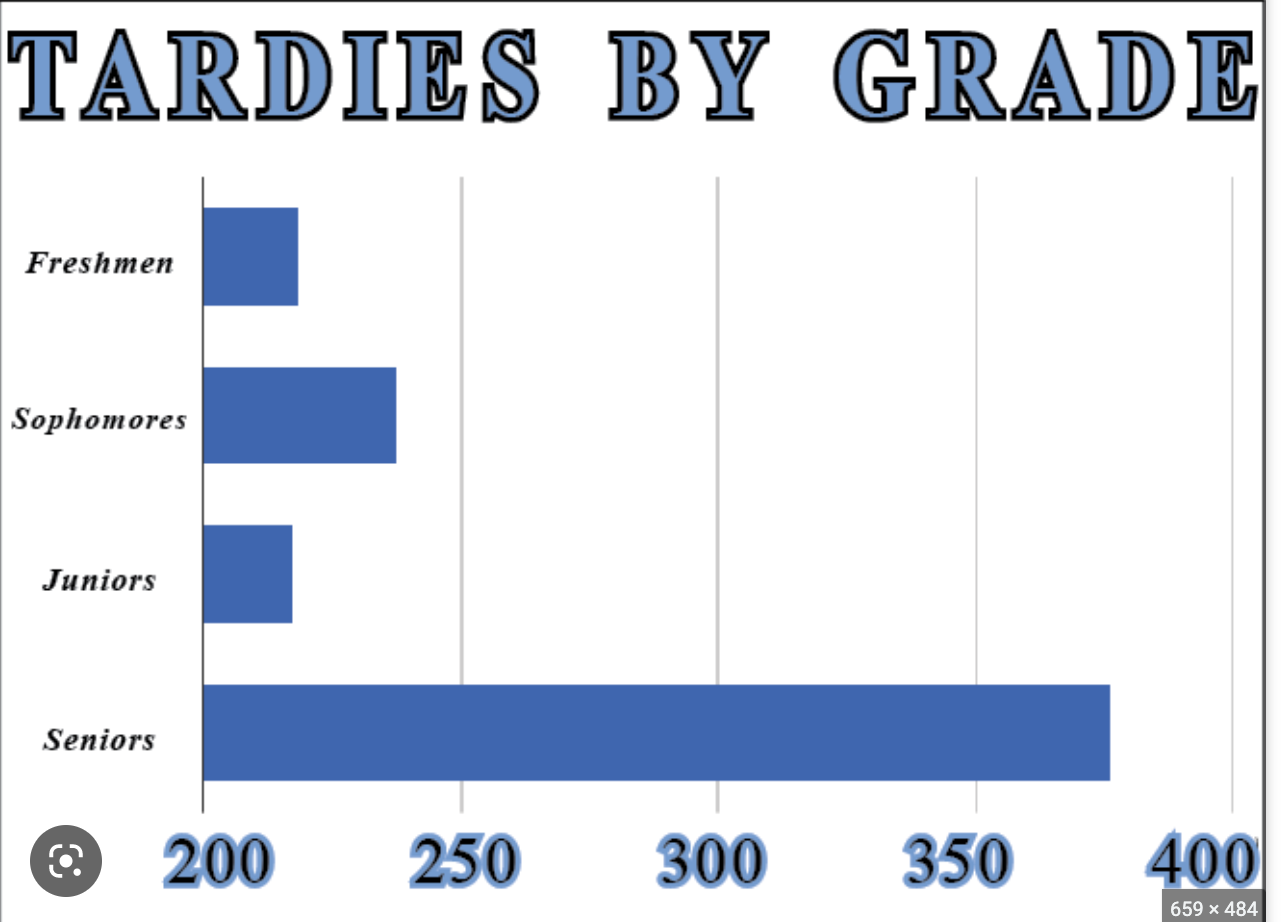
The chart above is a good example of a visualization of student data on tardies by grade.
Tell a story about the data in the visualization and the tardies at Iroquois High School.
The growth rate for all jobs (combined is how much?
The growth rate for data science is supposed to grow by how much?
Data scientists jobs are to do what?
It is important for people that are like YOU to enter data science because:
Presently all data scientists are mostly
An example of a good research question would be: Are there a lot of absences at Iroquois High School?
An exmple of a good research question would be: Many of the absences at Iroquois High School are preventable.
An example of a good hypothesis would be: Many of the absences at Iroquois High School are due to a lack of planning
An example of a good hypothesis would be: Many of the absences at Iroquois High School are due to physical or mental illness.
Select the dirty data example in response to the question: How old are you?