1
1
1
1
1
1
1
1
1
1
How do you feel you did on this assignment?
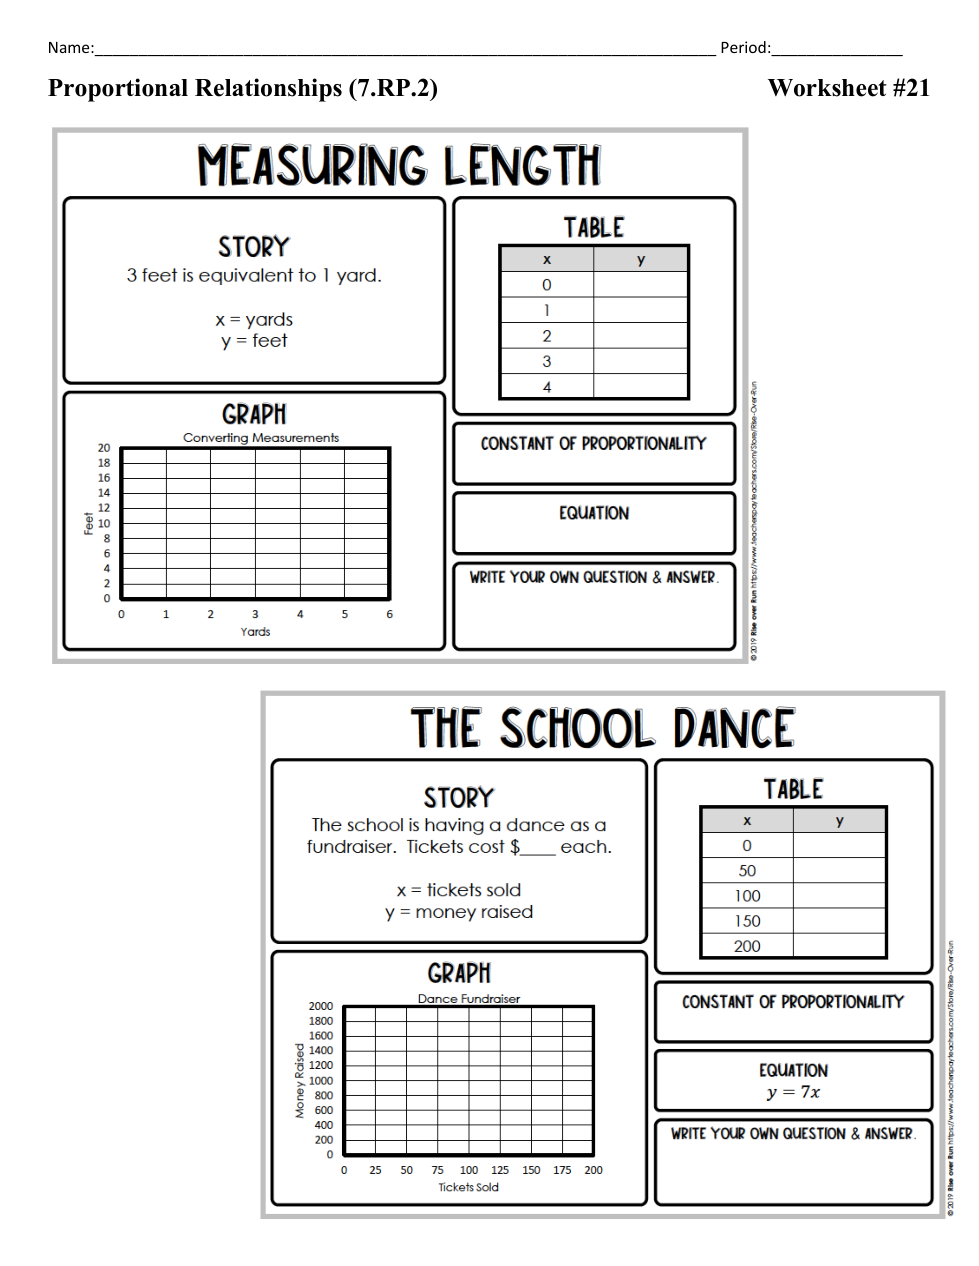
Graph the table.
What is the y-value when x=0
What is the y-value when x=3?
What is the constant of proportionality (unit rate)?
Write your answer like: 10 ft per yd
Write an equation for the table.
Write your answer like: y=10x
How much does each ticket cost?
Graph the date from the table.
What is the y-value when x=50?
What is the y-value when x=200?
What is the constant of Proportionality?
Write your answer like: $10 per ticket
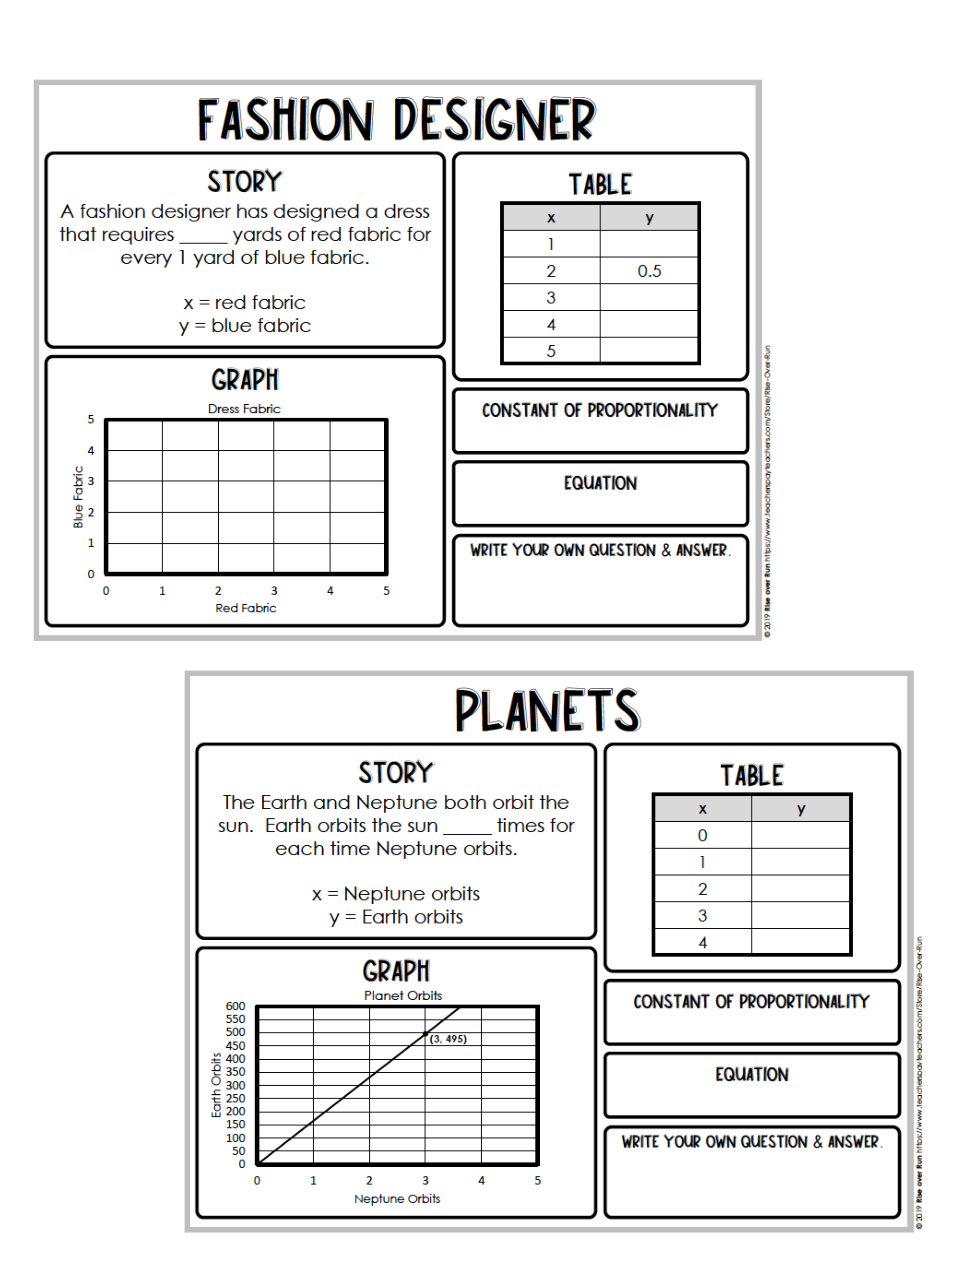
How many yards of red fabric is required for 1 yard of blue fabric?
Graph the data from the table.
What is the y-value when x=4?
What is the constant of proportionality?
Write your answer like:
0.10 blue per red
Write an equation from the table.
Write your answer like: y=0.10x
How many times does the earth orbit the sun for each time Neptune orbits?
What is the y-value when x=1?
What is the y-value when x=2?
What is the constant of proportionality?
Write your answer like:
10 earth per neptune
Write an equation from the graph.
Write your answer like: y=10x