Homework 9 - Equations as Functions
star
star
star
star
star
Last updated over 1 year ago
17 questions
1
1
1
1
1
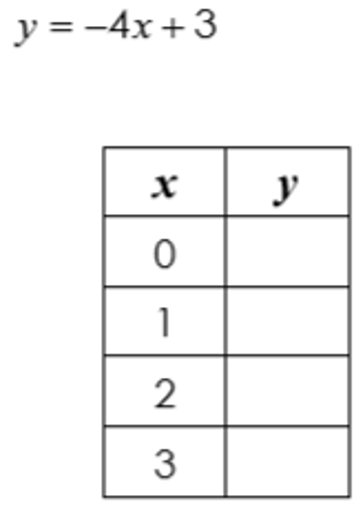
Use your answers from problems 1 through 4 to plot the points.
1
- Click the graph tab.
- Click on the graph background to add a point. Add two points to create a graph. Drag a point or type in x and y coordinates to edit its position. Click on a point to delete it.
1
Does your graph from problem #5 match the graph in problem #6?
1
1
1
1
1
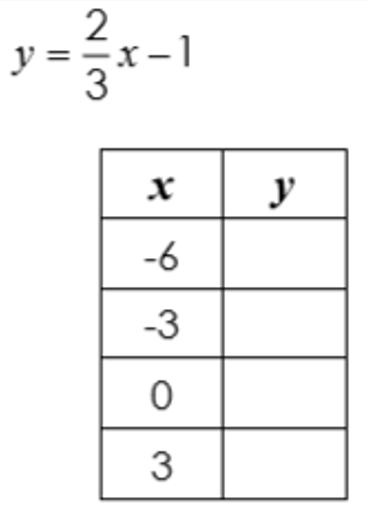
Use your answers from problems 8 through 11 to plot the points.
1
- Click the graph tab.
- Click on the graph background to add a point. Add two points to create a graph. Drag a point or type in x and y coordinates to edit its position. Click on a point to delete it.
1
Does your graph from problem #12 match the graph in problem #13?
1
Find the range of the function y = 7x - 1 when the domain is {-1, 0, 1}
1
y=\frac{2}{3}x+4
y=\frac{2}{3}x+4
1
y = x - 7
y = x - 7