A ____________________ is used to measure air pressure.
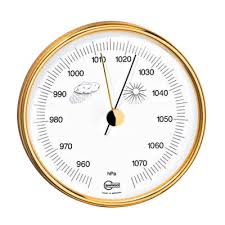
A ____________________ is used to measure air pressure.
A ____________________ is used to measure air pressure.
We measure temperature using a _________________.
A ____________________ is used to measure the amount of humidity and
water vapor in the atmosphere.
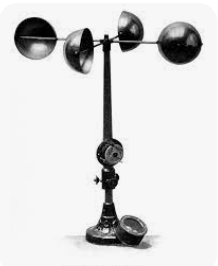
This weather instrument is used to measure wind speed.
Which tool do we use to measure the duration, movement, and intensity of precipitation?
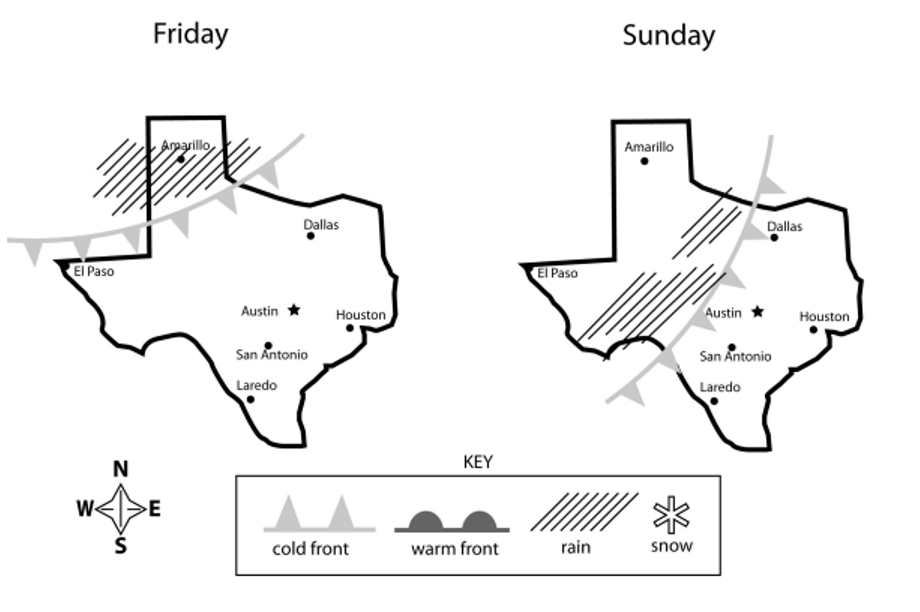
These weather maps show conditions in Texas on two days.
Which city on the map had rain on Friday which had cleared by Sunday?
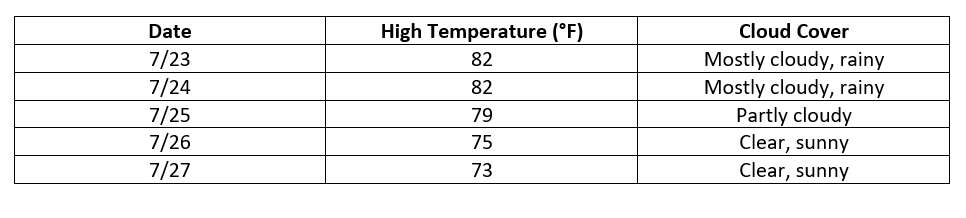
The table shows some weather data collected over a five day period.
Which pattern over the five days can be observed in the collected data?
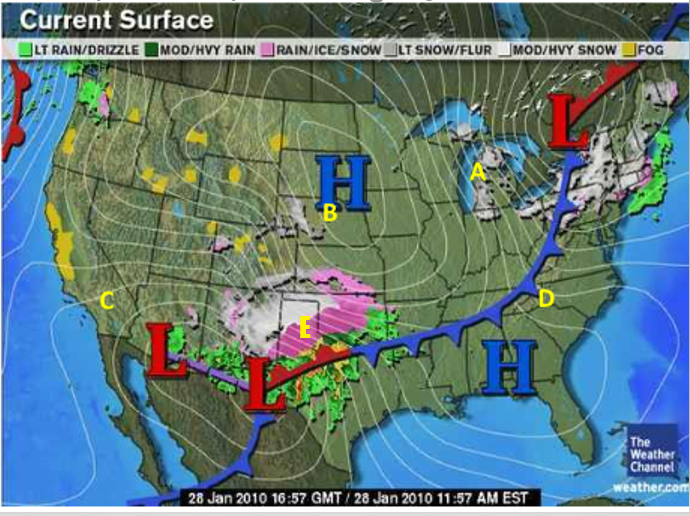
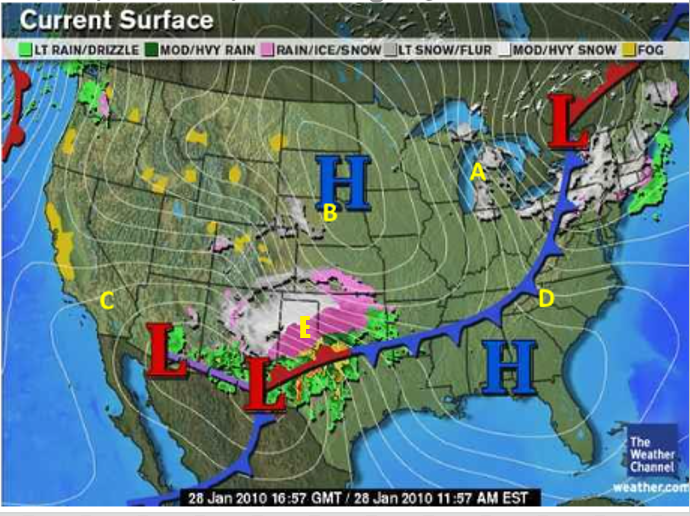
Use the following map to answer the question.
What type of weather would likely be happening in northern Texas at letter E?
Use the following map to answer the question.
Thunderstorms are most likely to occur at which letter?
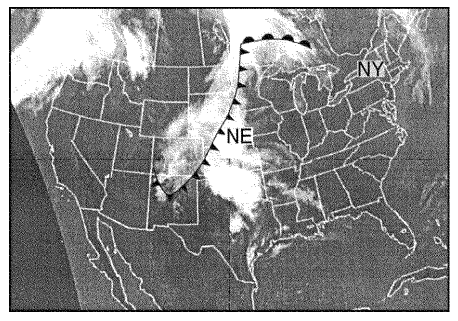
The satellite image below shows cloud patterns associated with weather fronts over the United States on a certain day. The states of Nebraska (NE) and New York (NY) have been labeled.
At the time this satellite image was taken, what were the weather conditions in New York State?