Data & Statistics Quiz SOL 5.16
star
star
star
star
star
Last updated over 3 years ago
13 Nsɛmmisa

1
1
1
The science test scores of the 5th grade class at Fairview were recorded in this stem and leaf plot. How many students scored at least a 70?
How many students scored less than 65 points on their test?
Based upon the data point in the set, what is the range of test scores from the class?
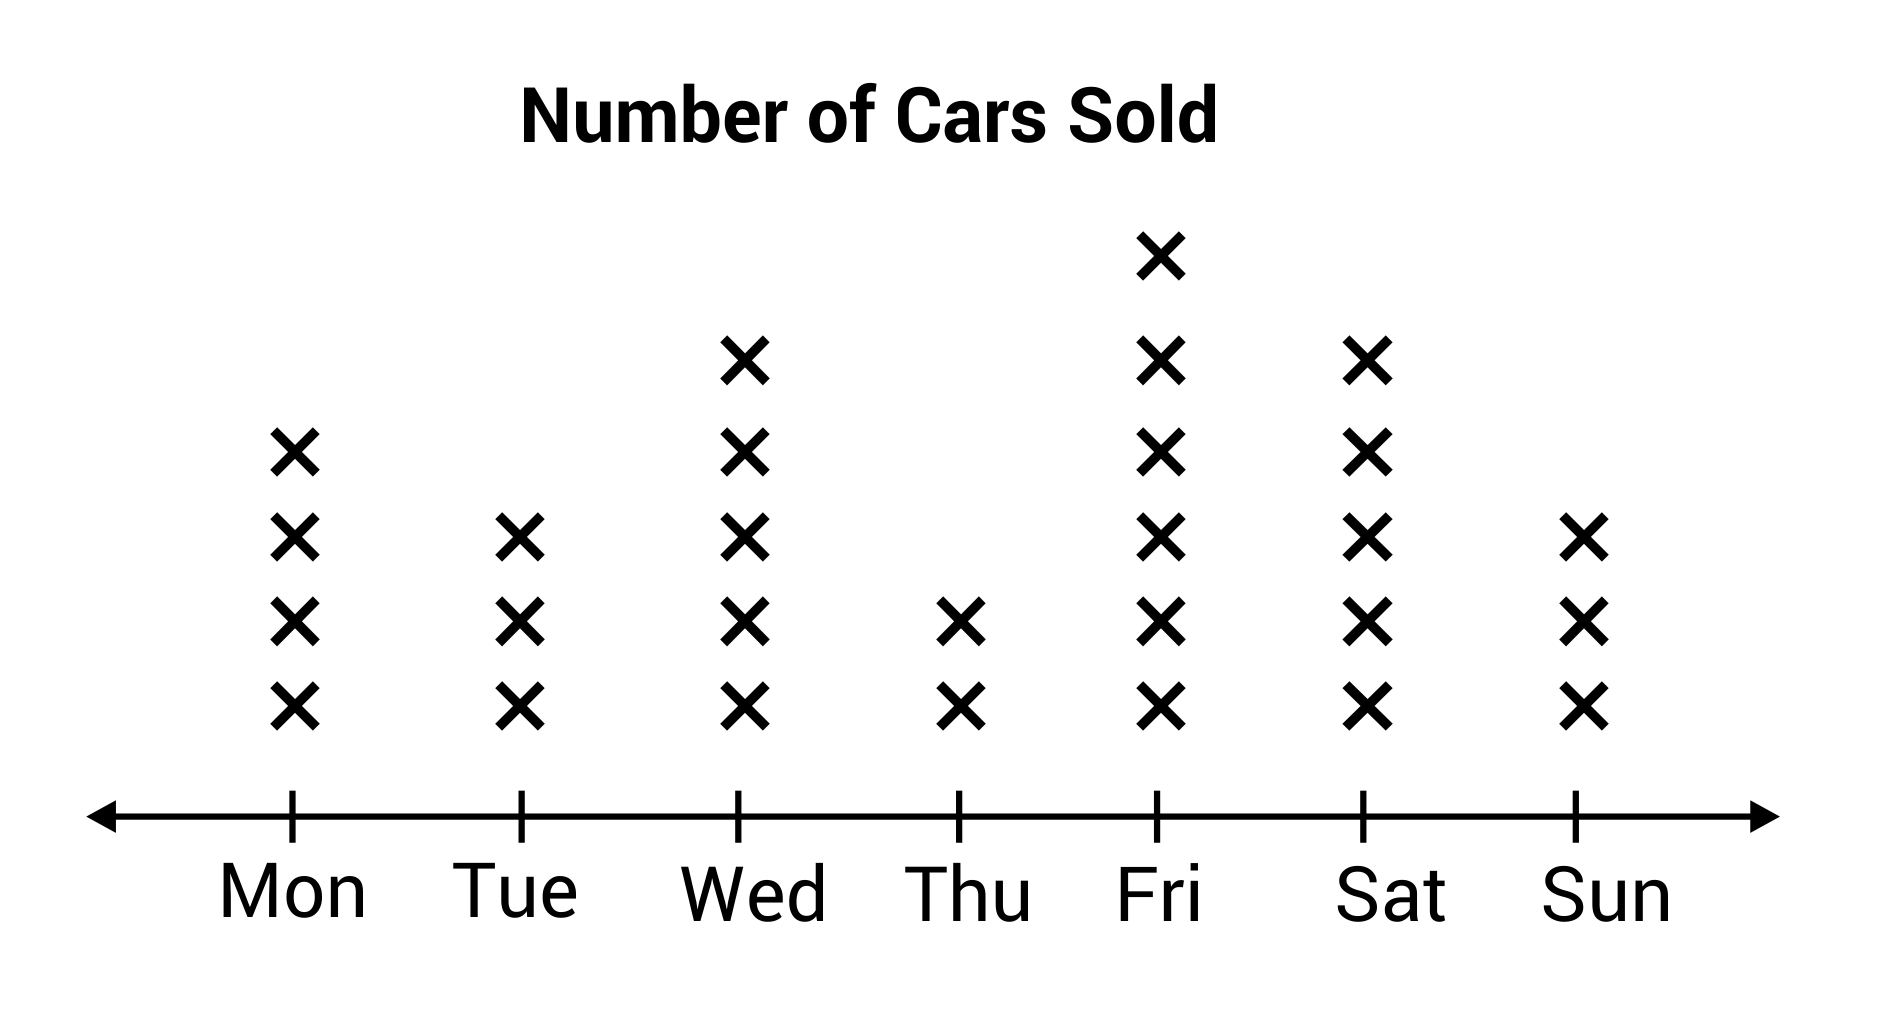
The Sunnyside Car lot collected data of how many cars they sold in one week. The data is represented in the line plot shown. How many cars were sold total by the car lot?
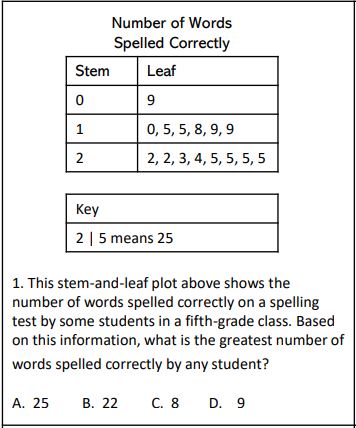
This stem and leaf plot shows the number of words spelled correctly on a spelling test by some students in a fifth grade class. Based on this information, what is the greatest number of words spelled correctly by any student?
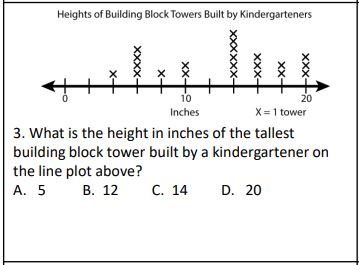
What is the height in inches of the tallest building block tower built by a kindergartener on the line plot?
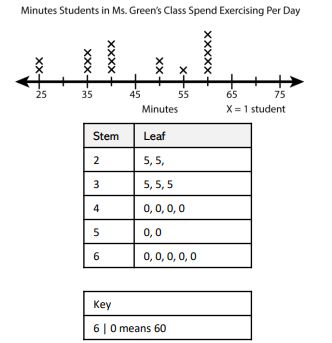
Ms. Green recorded the minutes students in her class exercise per day. What data point shown on the line plot is missing from the stem and leaf plot?
How many cars were sold after Friday?
How many more cars were sold on Friday and Saturday than Tuesday?
What is the mode of the data set in the stem and leaf plot?
How many building block towers were built by the kindergarteners?
How many students were surveyed altogether?
What is the range of minutes per day students exercised?