The table represents points on a graph of a linear function. What is the rate of change of y with respect to x?

The table represents points on a graph of a linear function. What is the rate of change of y with respect to x?
The table represents points on a graph of a linear function. What is the rate of change of y with respect to x?
The graph shows the amount of soft serve ice cream, in pints,
remaining in a dispenser based on the number of ice cream cones
purchased. Which of the following is NOT a true statement?

Jaxon is going to create a graph of the linear equation
3y – x = 12. Categorize the following statements. 2 are true and 2 are false.
The y-intercept will be located at (0, 4)
The line passes through the point (3, 5)
The slope of the line is 1/3
The x-intercept will be located at (-1, 0)
True
False
Graph the linear function
| Stavka koja se može prevući | arrow_right_alt | Odgovarajuća stavka |
|---|---|---|
| arrow_right_alt |
| |
| arrow_right_alt |
| |
| arrow_right_alt |
| |
| arrow_right_alt |
| |
| arrow_right_alt |
| |
| arrow_right_alt |
| |
| arrow_right_alt |
| |
| arrow_right_alt |
| |
| arrow_right_alt |
| |
| arrow_right_alt |
| |
| arrow_right_alt |
| |
| arrow_right_alt |
|
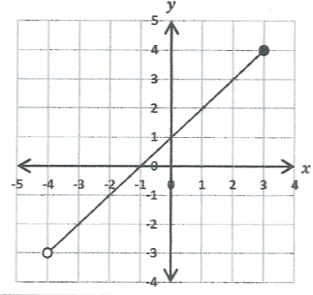
Write a slope-Intercept Equation for the graph:
y =
For the graph, choose the domain
Match the equations to the corresponding graph. Each graph will have 4 equations.

Orange line
Green line
What is the value of x that makes the equation true? (enter number only)
For the graph, choose the range


