Use x for # of tickets and y for cost
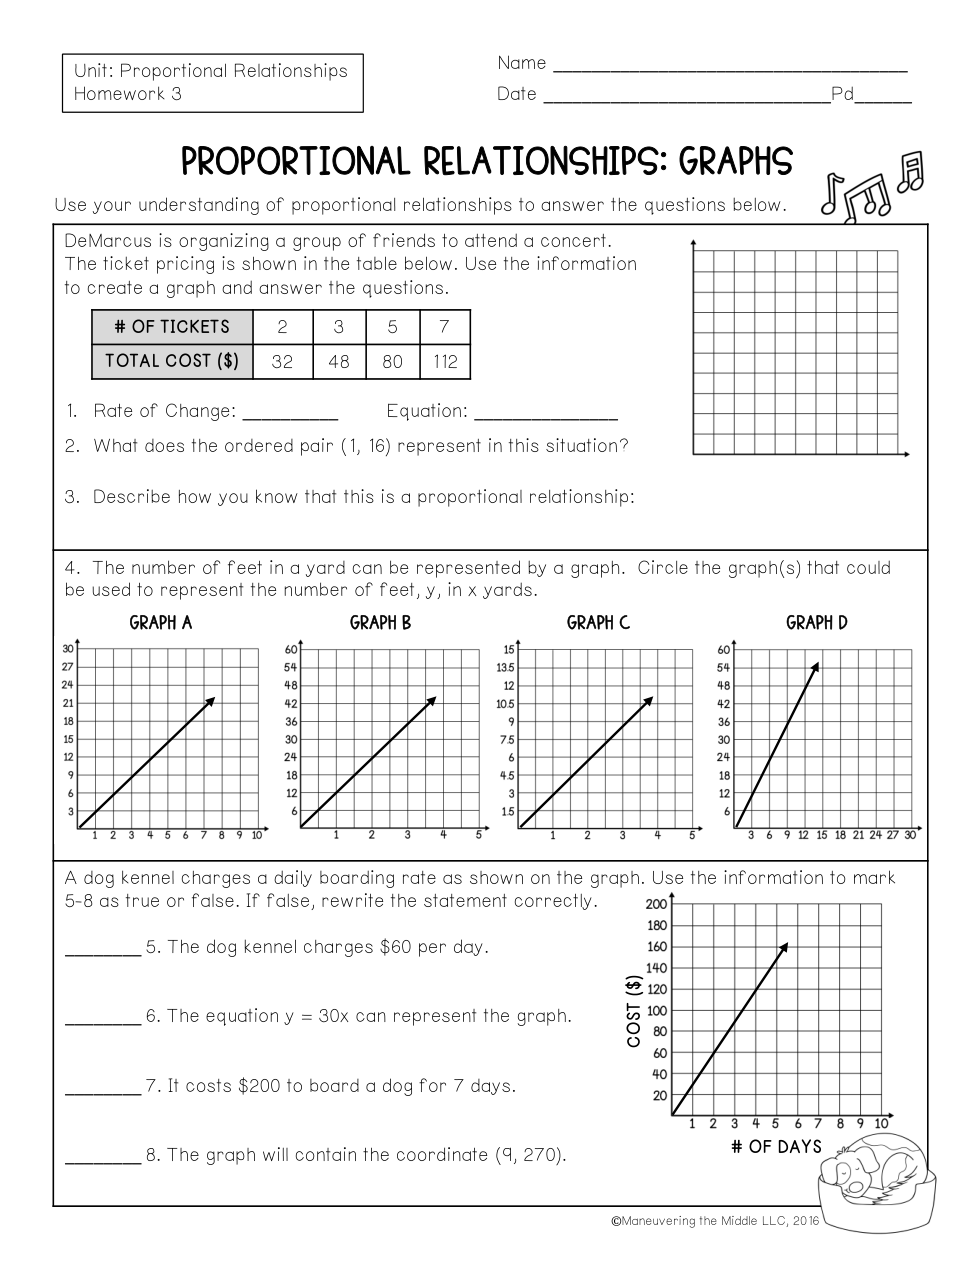
Graph A
Graph B
Graph C
Graph D
Tačno
Netačno
Upload a picture of your work page.