
Given the data:
Height of roller coaster (ft): 116.5 51.8 305.0 72.2 205.0 195.0 124.6
Speed of roller coaster (mph): 47.0 35.0 90.0 46.6 71.0 67.0 43.5
Use quadratic regression and write the resulting equation from the a, b and c values that Desmos gives you.
use y= in your answer and round your a, b and c values to include at least 3 numbers after any zeros
Given the data:
Height of roller coaster (ft): 116.5 51.8 305.0 72.2 205.0 195.0 124.6
Speed of roller coaster (mph): 47.0 35.0 90.0 46.6 71.0 67.0 43.5
Using quadratic regression, what is:
for this regression?
round your answer to the nearest thosandths place..3 places beyond the decimal (ex. 0.987)
Given the data:
Height of roller coaster (ft): 116.5 51.8 305.0 72.2 205.0 195.0 124.6
Speed of roller coaster (mph): 47.0 35.0 90.0 46.6 71.0 67.0 43.5
Use exponetial regression and write the resulting equation from the a and b values that Desmos gives you.
use y= in your answer and round your a & b values to the nearest thousandths place.
Given the data:
Height of roller coaster (ft): 116.5 51.8 305.0 72.2 205.0 195.0 124.6
Speed of roller coaster (mph): 47.0 35.0 90.0 46.6 71.0 67.0 43.5
Using exponential regression, what is:
for this regression?
round your answer to the nearest thosandths place..3 places beyond the decimal (ex. 0.987)
Given the
values in questions 2 and 4, which regression is best fit?
Explain why you chose your answer for #5.
Given the data:
amount of calories consumed
(in thousands): 1.4 1.5 1.6 1.7 1.9 1.9 2.3 2.5 2.9 3.0 3.5 4.0
amount of weight gained: 0 0 0 0.1 0 0.2 0.2 0.3 0.6 0.7 0.8 1.2
Use quadratic regression and write the resulting equation from the a, b and c values that Desmos gives you.
use y= in your answer and round your a, b and c values to at least 3 values after the decimal
Given the data:
amount of calories consumed
(in thousands): 1.4 1.5 1.6 1.7 1.9 1.9 2.3 2.5 2.9 3.0 3.5 4.0
amount of weight gained: 0 0 0 0.1 0 0.2 0.2 0.3 0.6 0.7 0.8 1.2
Using quadratic regression, what is:
for this regression?
round your answer to the nearest thousandths place..3 places beyond the decimal (ex. 0.987)
Given the data:
amount of calories consumed
(in thousands): 1.4 1.5 1.6 1.7 1.9 1.9 2.3 2.5 2.9 3.0 3.5 4.0
amount of weight gained: 0 0 0 0.1 0 0.2 0.2 0.3 0.6 0.7 0.8 1.2
Use exponential regression and write the resulting equation from the a & b values that Desmos gives you.
use y= in your answer and round your a & b values to the nearest thousandths place.
Given the data:
amount of calories consumed
(in thousands): 1.4 1.5 1.6 1.7 1.9 1.9 2.3 2.5 2.9 3.0 3.5 4.0
amount of weight gained: 0 0 0 0.1 0 0.2 0.2 0.3 0.6 0.7 0.8 1.2
Using exponential regression, what is:
for this regression?
round your answer to the nearest thousandths place..3 places beyond the decimal (ex. 0.987)
Given the
values in questions 8 and 10, which regression is best fit?
Explain why you chose your answer for #11.
A scientist obtained a sample that contained 80 grams of radioactive Barium-122 that decays exponentially over time. The amount of Barius-122 that remained in the sample at observed times is shown in the table.
If the radioactive decay continues at the same rate, which is closest to the amount of the sample of Barium-122 remaining at 5 minutes?
Use regression to decide which is closest to the mass at 5 minutes.
Use regression to decide which type of function this fits best...then find the answer.
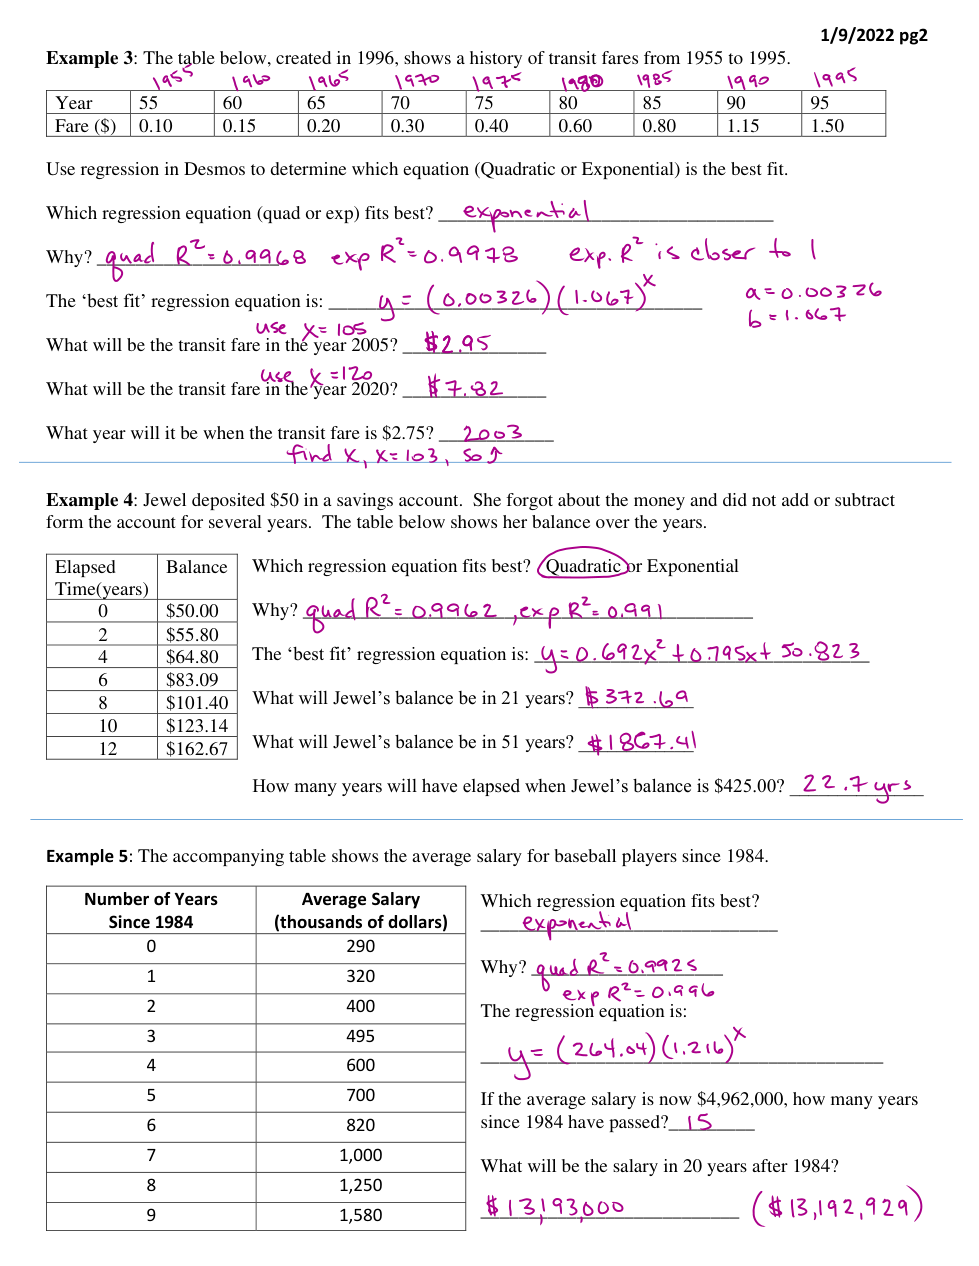
The accompanying table shows the average salary for baseball players since 1984.
What will the average salary for a baseball player be at 12 years since 1984? _______
round to the whole number in dollars (ex. $6259)
The accompanying table shows the average salary for baseball players since 1984.
What will the average salary for a baseball player be at 23 years since 1984? _______
The accompanying table shows the average salary for baseball players since 1984.
About how many years since 1984 will it be when the average salary for baseball players is $2,350?
(round your answer to the nearest whole number)


