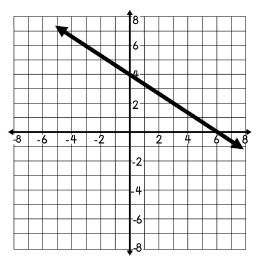
The graph of a linear function is shown. Find the rate of change of y with respect to x.

The graph of a linear function is shown. Find the rate of change of y with respect to x.
For the linear function f,
and
What is the slope intercept form of the equation that best represents the function?
Which graph represents a linear function with a zero of -6 and a y-intercept of 4?
The graph of a linear function is shown. Find the rate of change of y with respect to x.
Graph the equation
Which equation best represents the linear function shown?
The table shows the relationship between the minutes since it began raining and the inchesof water in a dog bowl outside. What is the rate of change of the inches of water with respect to the minutes since it began raining?
Which linear inequality is represented by the graph below?
y1/2x + 3
The graph of the equation
is shown below. Which ordered pair is included in the solution set of
Which graph best represents the solution set to the inequality
Mia bought a used car for $9500. It is expected that the value of the car will decrease by an average of $750 each year. Which function can be used to find the vaule of the car in x years after Mia purchased it?
The table represents points on the graph of a linear function. Which equation could be used to represent the same relationship?


