Twa kɔ nsɛm atitiriw so
Log in
Sign up for FREE
arrow_back
Laabri

Data & Statistics (line & stem/leaf plot) MMMR

star
star
star
star
star
Last updated over 3 years ago
18 Nsɛmmisa
Ɛhia
1
Ɛhia
1
Ɛhia
1
Asemmisa {{asɛmmisaAhyɛnsode}}
1.

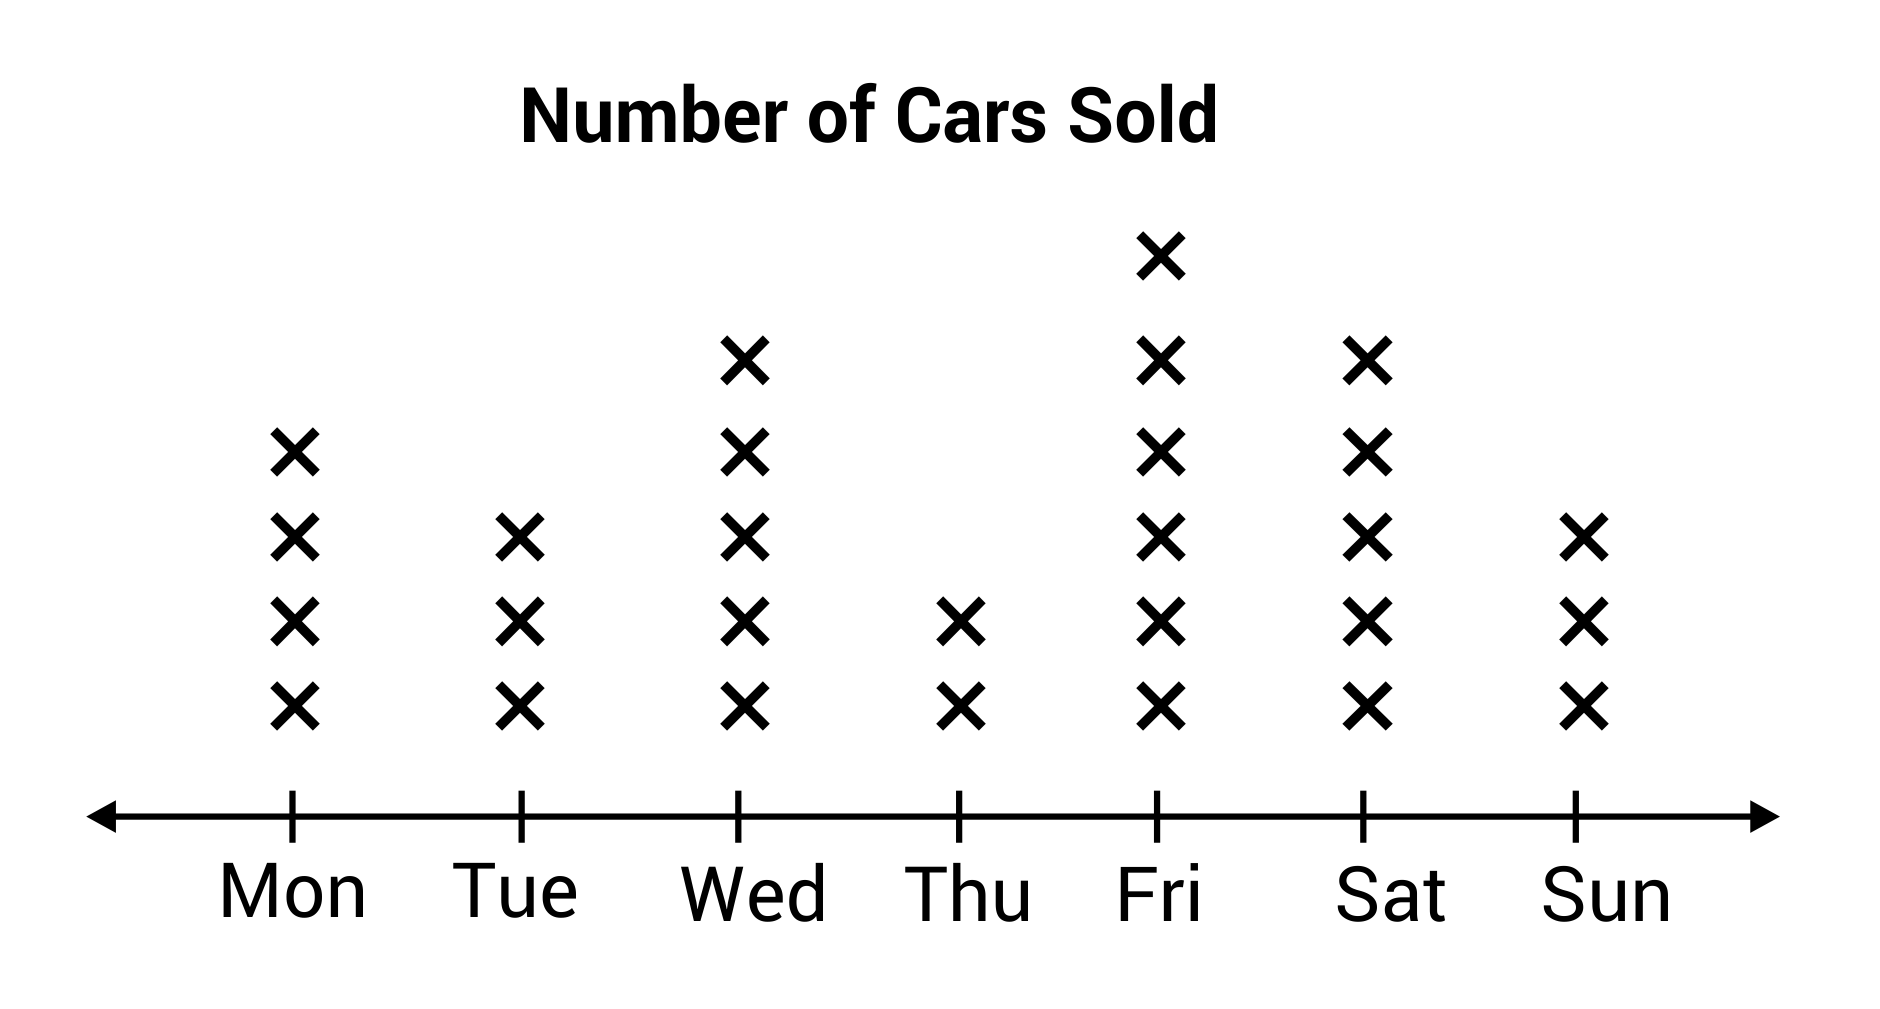
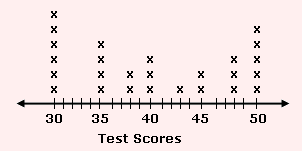
What is the mode of the following data set?

Ɛhia
1
Asemmisa {{asɛmmisaAhyɛnsode}}
2.

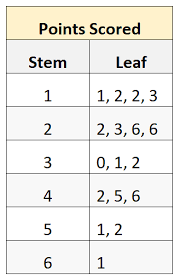
What is the median of the following data set?

Ɛhia
1
Asemmisa {{asɛmmisaAhyɛnsode}}
3.

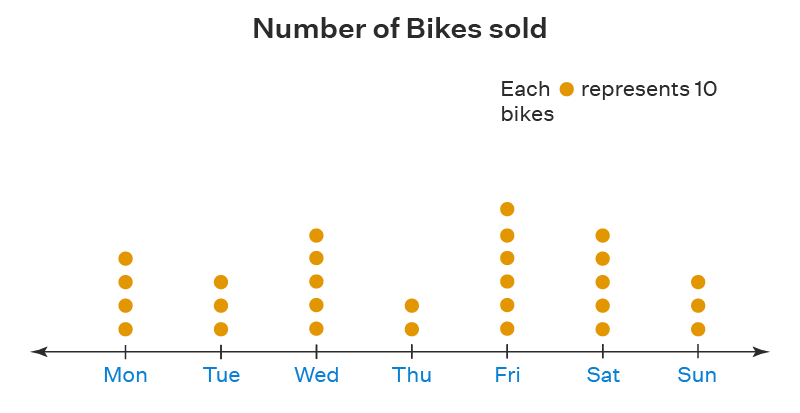
What is the measure of spread for the following data set?

Ɛhia
1
Asemmisa {{asɛmmisaAhyɛnsode}}
4.

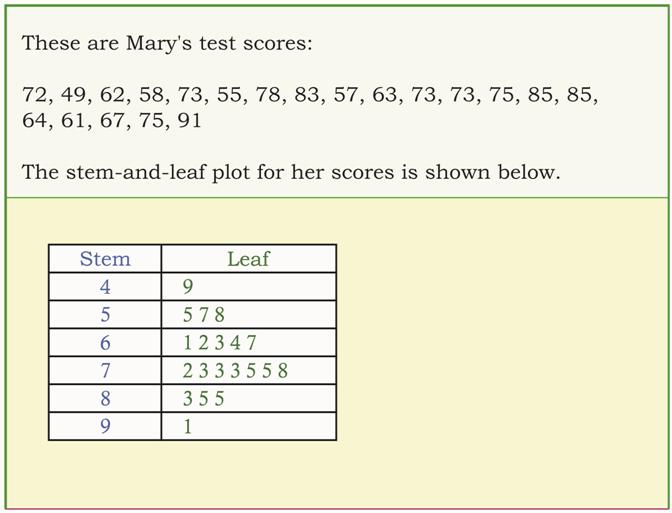
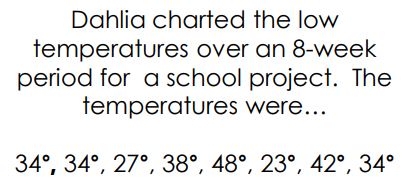
What is the mean of the following data set?

Ɛhia
1
Asemmisa {{asɛmmisaAhyɛnsode}}
5.

How many more cars were sold on Friday and Saturday than Tuesday?

Ɛhia
1
Ɛhia
1
Ɛhia
1
Ɛhia
1
Ɛhia
1
Ɛhia
1
Asemmisa {{asɛmmisaAhyɛnsode}}
12.

The stem and leaf plot shows the number of bicycles sold at Walmart during the holiday season.

*Pay close attention to the key*

How many bikes were sold Wednesday through Friday?

Asemmisa {{asɛmmisaAhyɛnsode}}
13.

The stem and leaf plot shows the number of bicycles sold at Walmart during the holiday season.

*Pay close attention to the key*

On which days were at least 40 bikes sold?

Ɛhia
1
Asemmisa {{asɛmmisaAhyɛnsode}}
14.

The data set shown lists Mary's test scores in 5th grade at Highpoint Elementary School.

What is the measure of variation within the data set?

Ɛhia
1
Ɛhia
1
Ɛhia
1
Asemmisa {{asɛmmisaAhyɛnsode}}
17.

The data set shown lists the test scores for Mr. Herrig's science benchmark test.

How many students completed the test?

Ɛhia
1
Asemmisa {{asɛmmisaAhyɛnsode}}
6.

How many cars were sold Wednesday or after?

Asemmisa {{asɛmmisaAhyɛnsode}}
7.

How many cars did the car lot sell total?

Asemmisa {{asɛmmisaAhyɛnsode}}
8.

The stem and leaf plot shows the number of points scored during each game during the season for the Chicago Bulls.

In the stem and leaf plot shown, what data point is the outlier?

Asemmisa {{asɛmmisaAhyɛnsode}}
9.

The stem and leaf plot shows the number of points scored during each game during the season for the Chicago Bulls.

In the following data set, what is the mode?

Asemmisa {{asɛmmisaAhyɛnsode}}
10.

The stem and leaf plot shows the number of points scored during each game during the season for the Chicago Bulls.

In how many games were at least 30 points scored?

Asemmisa {{asɛmmisaAhyɛnsode}}
11.

The stem and leaf plot shows the number of points scored during each game during the season for the Chicago Bulls.

What is the average number of points scored during their season?

Asemmisa {{asɛmmisaAhyɛnsode}}
15.

The data set shown lists Mary's test scores in 5th grade at Highpoint Elementary School.

What is the median of the data set?

Asemmisa {{asɛmmisaAhyɛnsode}}
16.

The data set shown lists Mary's test scores in 5th grade at Highpoint Elementary School.

If these are all the grades that will be averaged for her report card, what will her final grade be?

Asemmisa {{asɛmmisaAhyɛnsode}}
18.

The data set shown lists the test scores for Mr. Herrig's science benchmark test.

If a new student were to take the test, what would most likely be their grade?