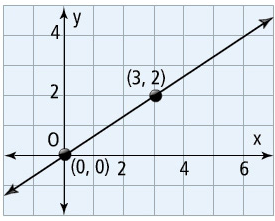
Determine the slope of the line shown in the graph.
Type the slope as a fraction in simplest form.

Determine the slope of the line shown in the graph.
Type the slope as a fraction in simplest form.
![]()
Determine the slope of the line shown in the graph.
Type the slope as a fraction in simplest form.
![]()
1. What does a coordinate or ordered pair show? What is it?
2. Give an example
Plot these points using the drawing tool:
(0,0) (-1, 2) (3, -4) (2, 5) (-5, -3)
Does the line shown in the graph represent a proportional relationship? Give at least one reason.
Write the correct format of a slope-intercept equation for a line:
The unit rate, shown as a fraction, is the same thing as the_______________.
What is the SLOPE shown in the equation y =
Determine the slope of the line shown in the graph.
Type the slope as a fraction in simplest form.
What is the SLOPE shown in the equation y = 2x + 4?
Determine the y-intercept of the line shown in the graph.
![]()
What is the y-intercept shown in the equation y =
What is the equation used to represent this graph:

What is the difference between these two lines? (line A and line B)
What is the same with the 2 lines?

Write the equation of the line.

What is the slope of this line?

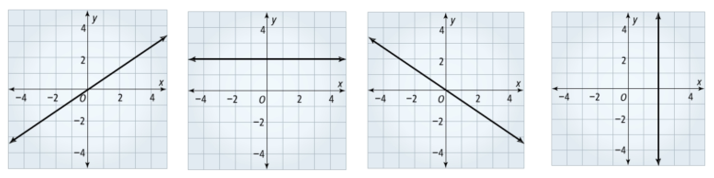
Identify the four types of slope by dragging and dropping the name of the slope onto the photo.
Graph the linear equation on the graph. Click on the drawing tool to the left. Draw 2 points on the graph. Then click on the line tool and connect the dots with a line.
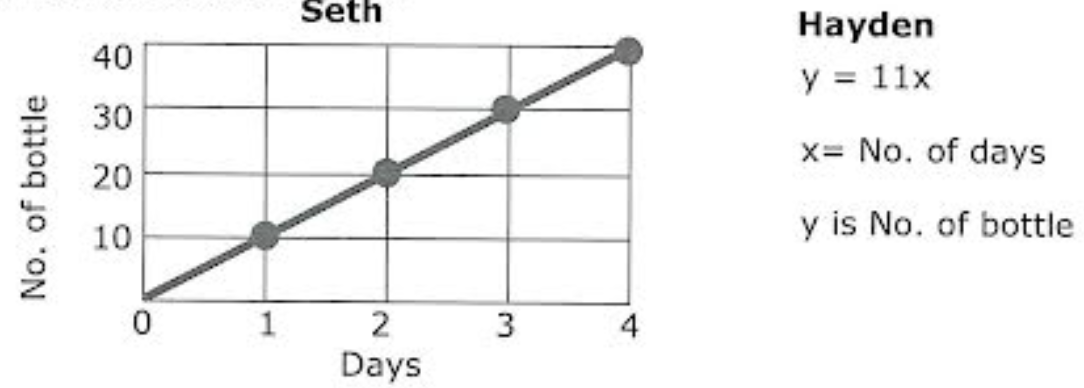
The graph below shows how many bottles Seth collected from the side of the road to recycle while he walked home from school. The equation shows how many Hayden collected.
Who collected the least number of bottles in 4 days? Explain how you know.