Log in
Sign up for FREE
arrow_back
Library

CARBON THROUGH THE SEASONS

star
star
star
star
star
Last updated over 1 year ago
18 questions
1
1
3
5
1
2
Question 5
5.

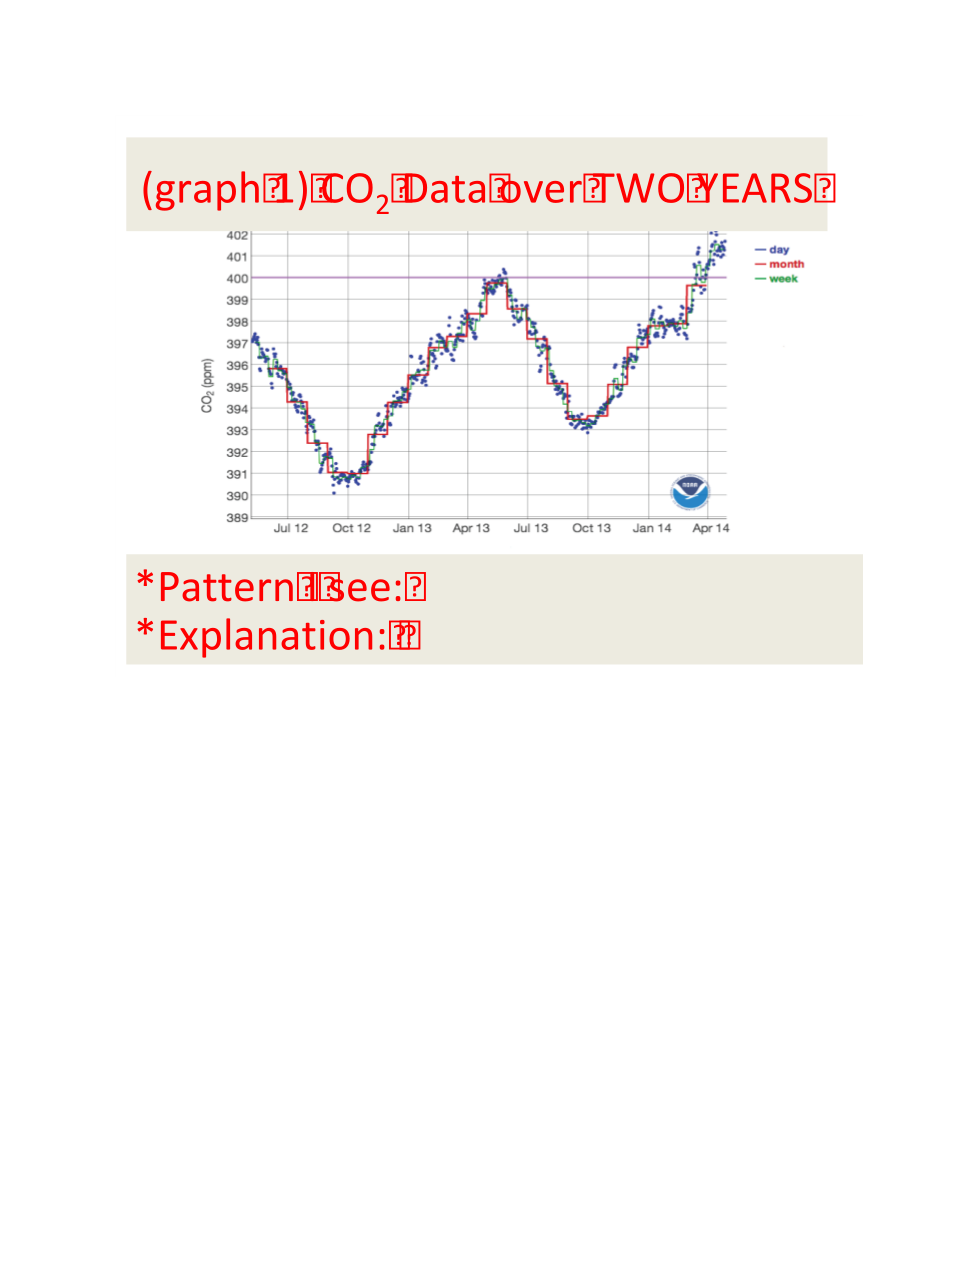
Identify the PATTERN you see in this Graph 1?

Question 6
6.

How can you EXPLAIN this pattern in Graph 1?

1
Question 7
7.

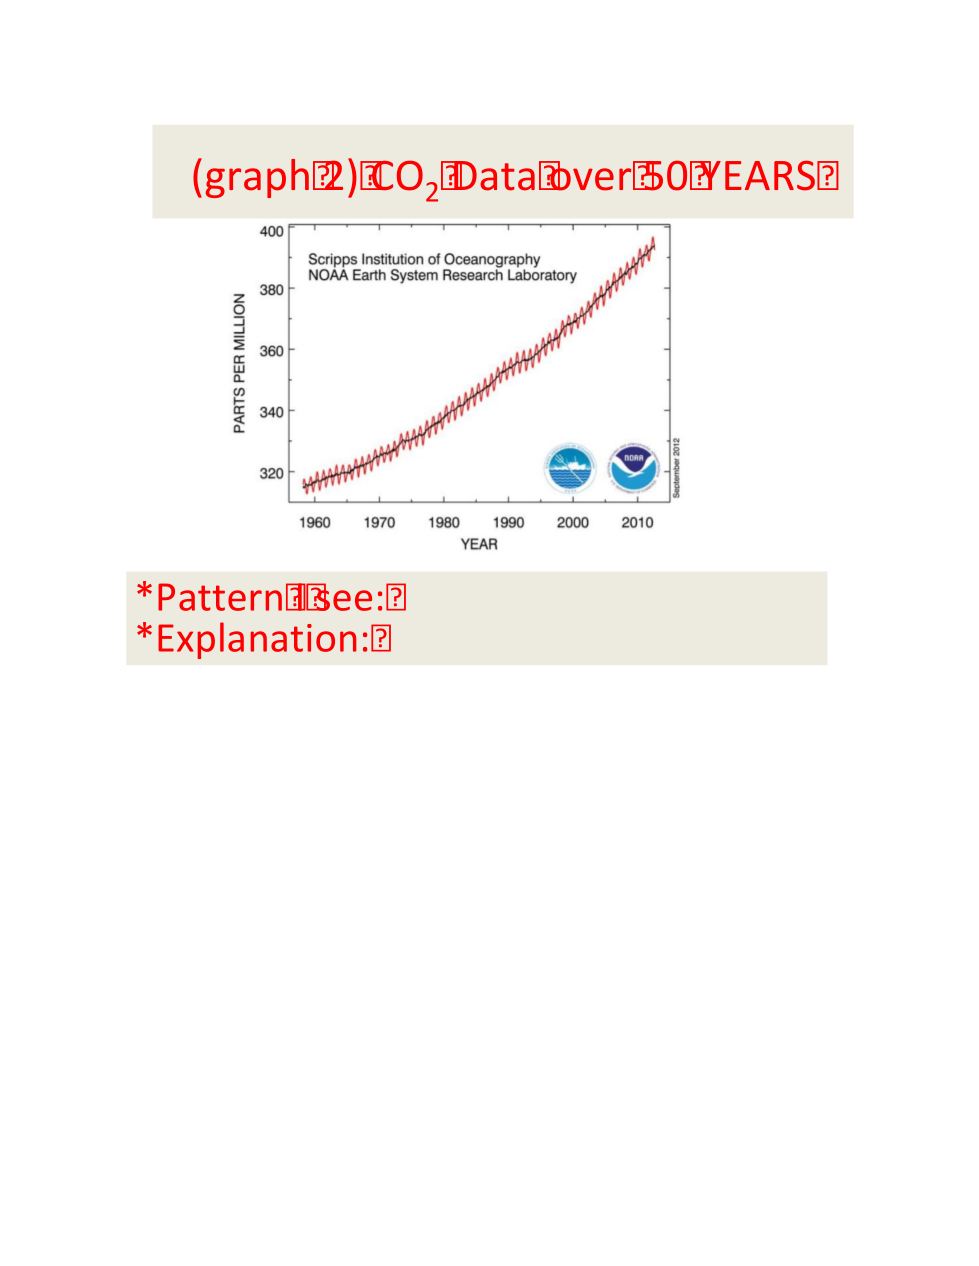
Identify the PATTERN you see in this Graph 2?

1
1
1
2
1
4
1
2
1
1
2
BEFORE WE START:
Reading and making a graph
Remember:
SOURCES go UP into the atmosphere.
SINKS go DOWN into the ground and water.
Question 1
1.

Question 2
2.

Question 3
3.

Question 4
4.

TRY to set up how you would graph this data.

1. With the Line Tool, draw the X and Y axes.
2. With the Scribble Tool, label what you think would go on each axis.
3. With the Text Tool, label what each axis title would be.

Question 8
8.

How can you EXPLAIN this pattern in Graph 2?

Question 9
9.

Question 10
10.

Question 11
11.

Question 12
12.

Question 13
13.

List any 4 things that release CO2 into the atmosphere.

Question 14
14.

Question 15
15.

Question 16
16.

What do you think is the #1 reason why the CO2 is increasing over time?

Question 17
17.

Question 18
18.

Which season had the lowest CO2 levels and WHY?

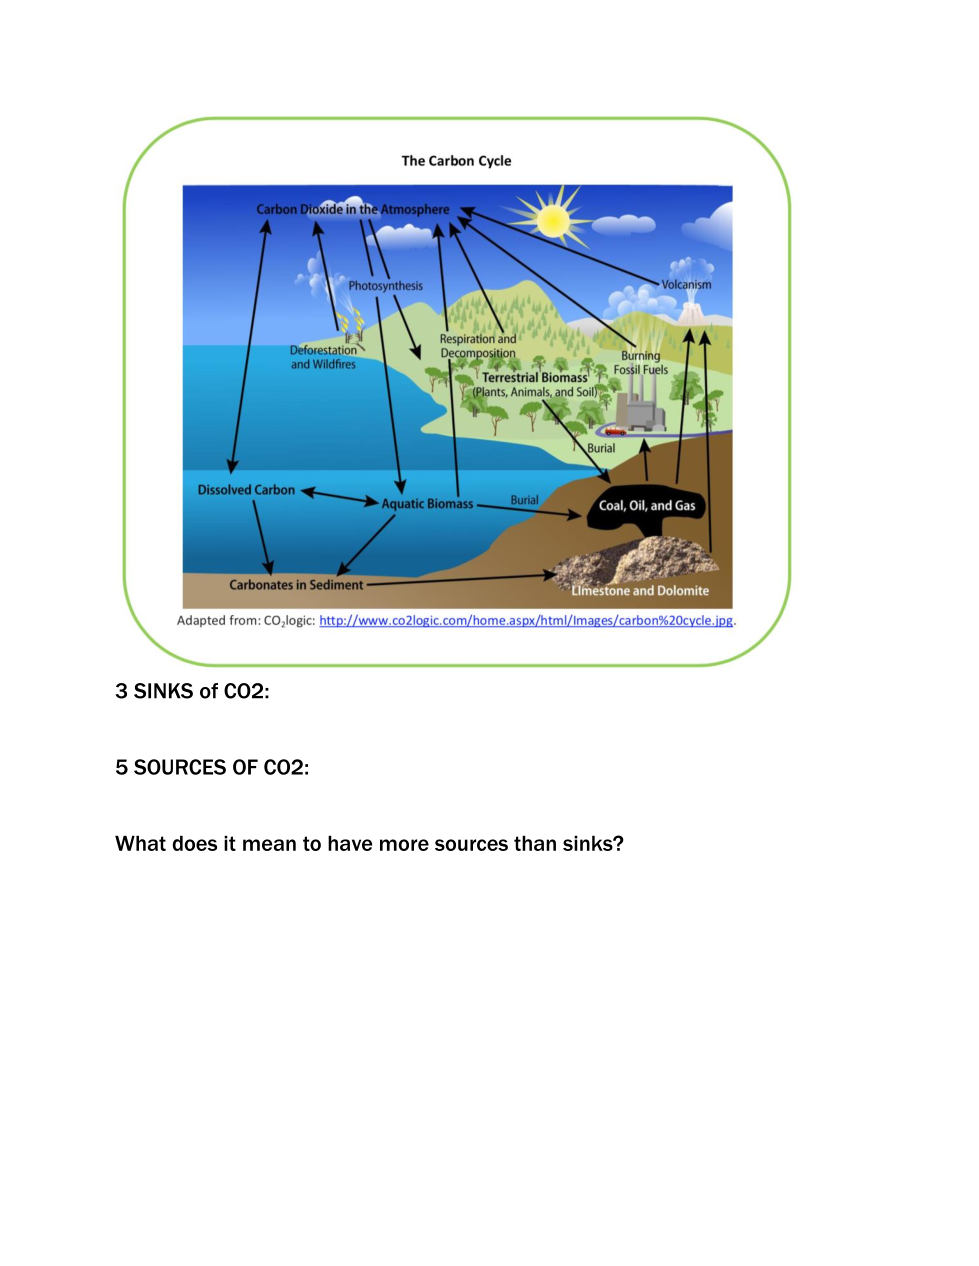
Which are the 3 SINKS of CO2?
respiration and decomposition
volcanoes erupting
photosynthesis by plankton
dissolving INTO water and rock
deforestation and wildfires
photosynthesis by trees
dissolving OUT OF water and rock
burning fossil fuels
Which are the 5 SOURCES of CO2?
dissolving INTO water and rock
photosynthesis by plankton
volcanoes erupting
burning fossil fuels
deforestation and wildfires
photosynthesis by trees
dissolving OUT OF water and rock
respiration and decomposition
What does it mean to have more sources than sinks of CO2?
there's too much CO2 in the air
there's too much CO2 in the land and water
What MOLECULE of matter was measured with all this data?
CH4
C6H12O6
CO2
H2O
O2
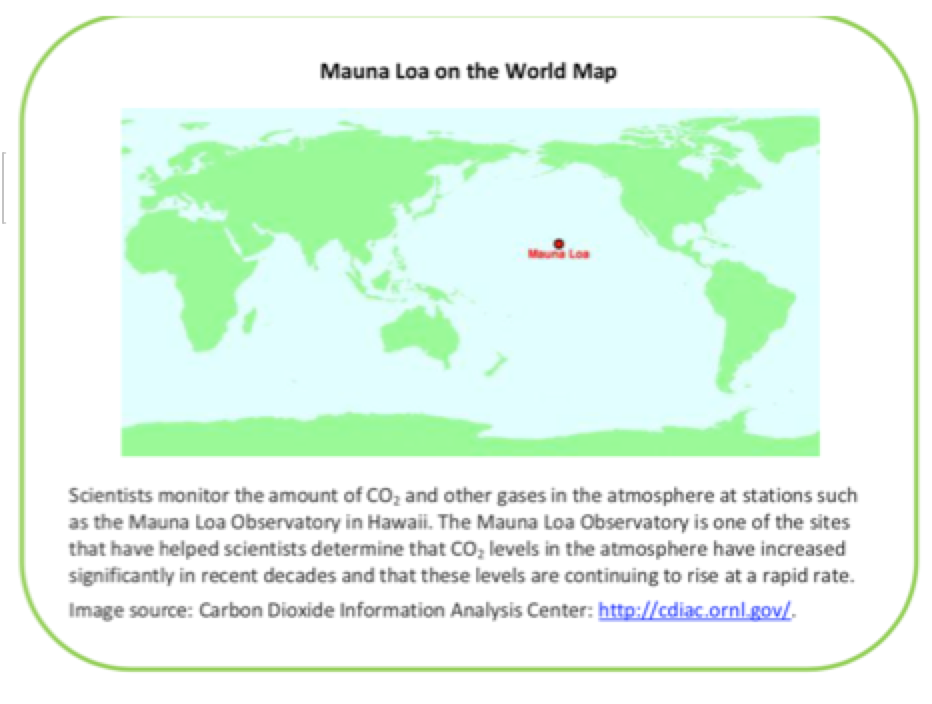
WHERE was this data collected from? (Click on "e" from page 1)
Columbia University in NYC
Mount Loa in Hawaii
from a satellite up in space
Mount St. Helens in Oregon
At a weather station in the Bahamas
Are the seasons the same in the Northern and Southern Hemispheres? (yes/no and why)
yes
no
bc the rotation of earth allows daytime and nighttime
bc the tilt of the earth allows one hemisphere to be getting more or less sun
bc the Earth revolves around the sun so its always hot by the equator
Which hemisphere has more LAND and therefore more CO2 being released from it into the atmosphere?
North
South
Would these 4 things be a SOURCE or a SINK of carbon?
sink
source
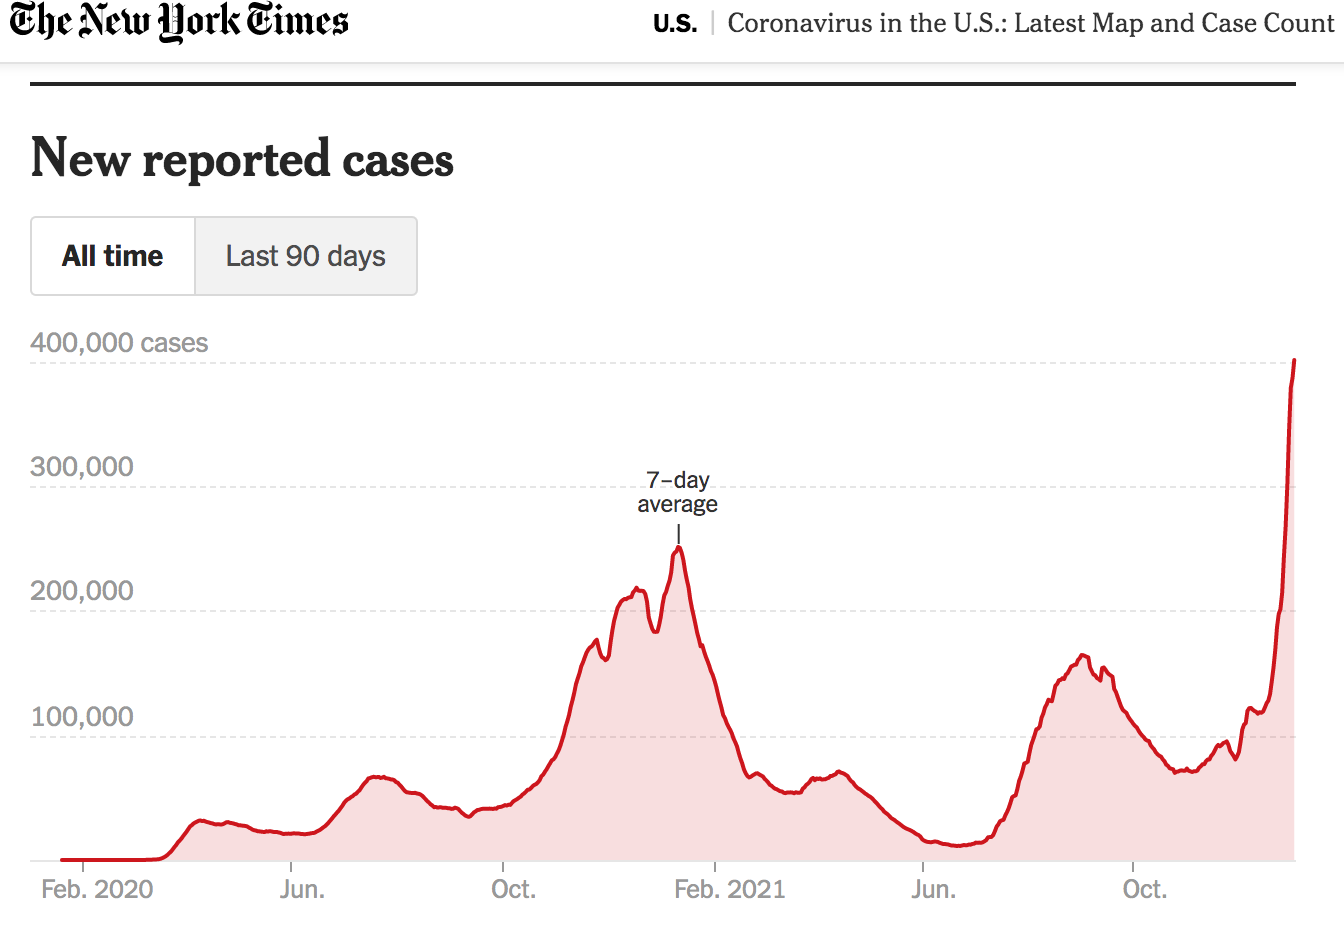
Which 2 patterns (trends) did you see in the data from the graphs?
the CO2 decreased in the fall and increased in the spring of each year
the CO2 decreased over 50 years
the CO2 increased over 50 years
the CO2 increased in the fall and decreased in the spring of each year
What do trees, plants, algae, phytoplankton, and cyanobacteria do with CO2?
release it
use it