2
What change will DECREASE the rate of reaction?
What change will DECREASE the rate of reaction?
2
1
Use this link if the videos are not playing. This is first two videos combined.
https://drive.google.com/file/d/1IO44R2N3BMLzvyxqvN4nyazHXxlfUp4W/view?usp=sharing
If you are watching the video in the google drive, watch for approximately 5:30 minutes before answering questions 1 - 3.
When is the rate of the reaction the slowest during a chemical reaction?
What does the gradient of an amount or mass vs time graph indicate?
How do we know from the graph when a reaction has ended?
Use the graph to calculate the initial rate of reaction (in cm3.s-1). NO UNIT IN ANSWER.
What is the mathematical relationship between time taken for precipitate to disappear and the temperature of the solution?
How long did it take (in seconds) for the reaction to be completed? NO UNIT IN ANSWER.
Use this graph to calculate the average rate of reaction (in cm3.s-1) for the entire reaction. NO UNIT IN ANSWER.
When is the rate of the reaction the fastest during a chemical reaction?
If you are struggling to watch these videos below, please use this link:
https://drive.google.com/file/d/1cFvONoLSdFyVgrepupejz2rwcx6P3Vit/view?usp=sharing
Questions 9 - 11 Watch the first 9:20 minutes to answer
Questions 12 - 13 Watch from 9:20 - 17:00 minutes to answer
Questions 14 - 16 Watch the rest of the video
Organise these metals from most reactive to least reactive.
potassium
sodium
lithium
What factor affecting rates of reactions was discussed in this video?
Of all the metals shown in this video, which metal is the most reactive?
Temperature directly proportional to the
What is the minimum amount of energy needed by particles in order to produce a successful collision known as?
Which of these explanations of why concentration affects the rate of reaction is correct?
In the laboratory, we can only manipulate the pressure of a
Catalysts do not participate in the chemical reaction.
What change will DECREASE the rate of reaction?
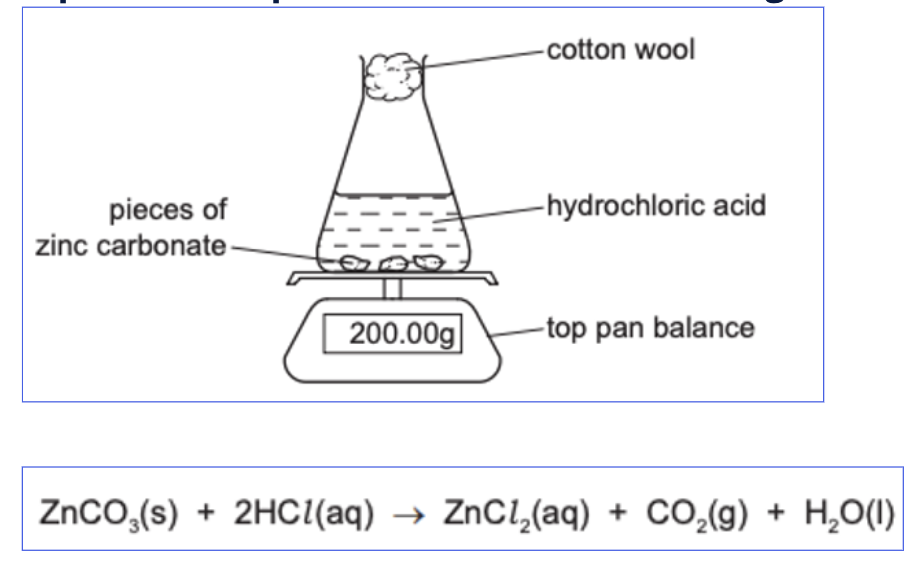
Explain why the mass of the reaction flask decreases over time.
Identify the factor being manipulated in order to affect the rate of reaction.
What is the independent variable for this experiment? (See hint)
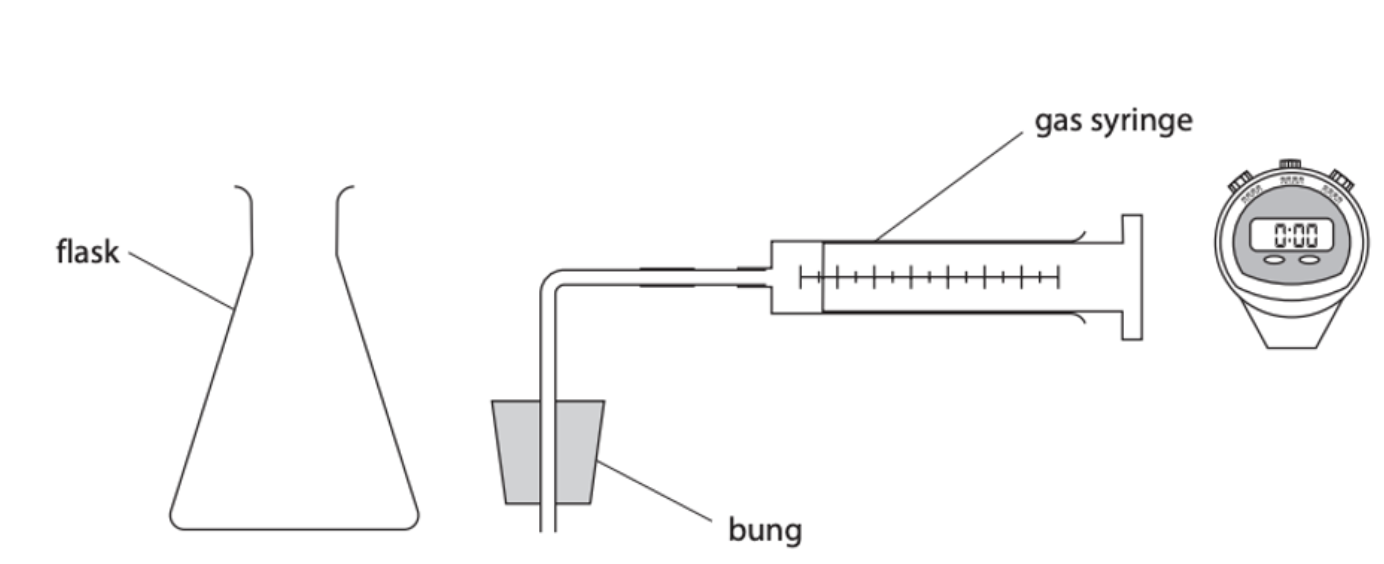
The following sentences describe the steps of his method. Arrange them in the correct sequence (order)
Quickly put the stopper into the flask with the gas syringe
Drop the magnesium ribbon into the acid
Record the volume of gas in the syringe every minute for 8 minutes
Clean the strip of magnesium ribbon to remove the magnesium oxide layer
Pour 50 cm3 of 0,5 mol.dm-3 hydrochloric acid into the empty flask
Consider this experiment you have learnt about. Identify the reactants used in this reaction. Select all that apply.
Which of the following changes will affect the measured rate of this reaction?
What change was made in this experiment?
Which statement regarding this experiment is FALSE?
What is the volume reading below, in cm3?

Write number value only, no unit.
Which one of these would be most suitable to use to measure a liquid of volume of 9 cm3?

What is the reading on this thermometer? The temperature is
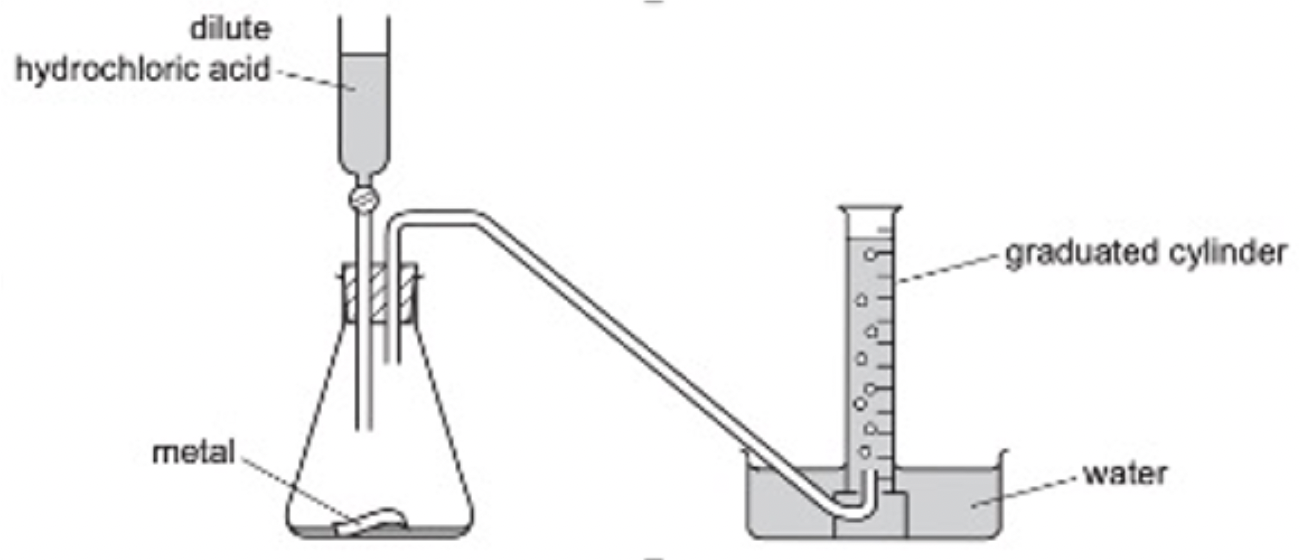
Write the name of the gas that is being collected in the inverted measuring cylinder.
Which of these Boltzmann distribution curves represents the effect of increasing the concentration of the acid in this experiment?
What is the dependent variable in this experiment?
Identify one controlled variable. Be specific in your answer.
What is the syringe reading at the start in cm3? Write number value ONLY.
What is the syringe reading at the end in cm3? Write number value ONLY.
What is the total volume of gas produced in cm3? Write number value ONLY.
The experiment was repeated. Which ONE of the following changes would cause the volume of gas collected to increase?
Which of the following Boltzmann distribution curves show the effect of this change?
