Asemmisa {{asɛmmisaAhyɛnsode}}
1.
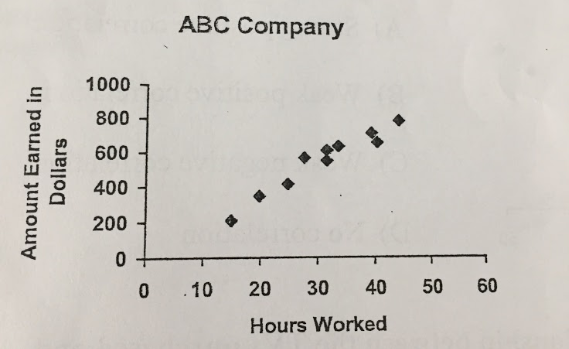
Which statement best describes the trend shown in the relationship from number 1?
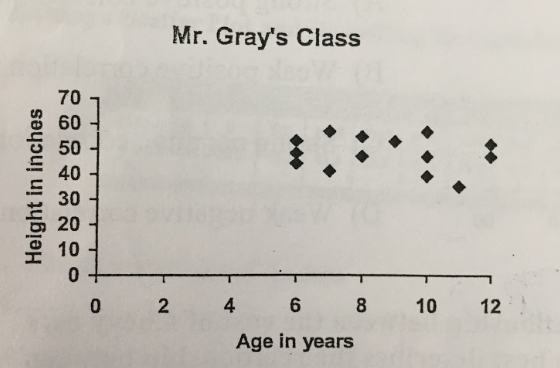
This scatter plot shows a relationship between age and height. Which best describes the relationship between the variables?
Which statement best describes the trend shown in the relationship from number 3?
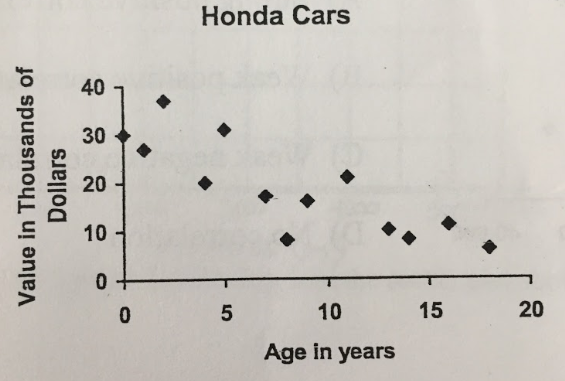
This scatter plot shows the relationship between the age of a car and its value. Which best describes the relationship between the variables?
Which statement best describes the trend shown in the relationship from number 5?
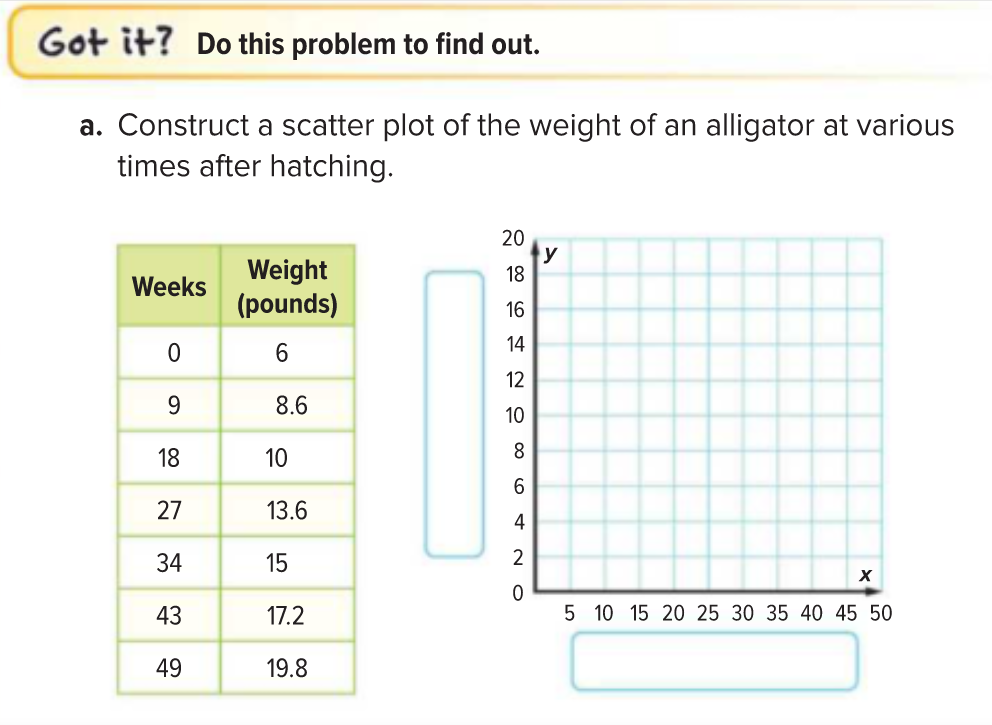
What is the title for the y-axis?
Title of x-axis
Click on "Show Your Work"
Click on the "dot" on the top of the choices on the left and graph the points.
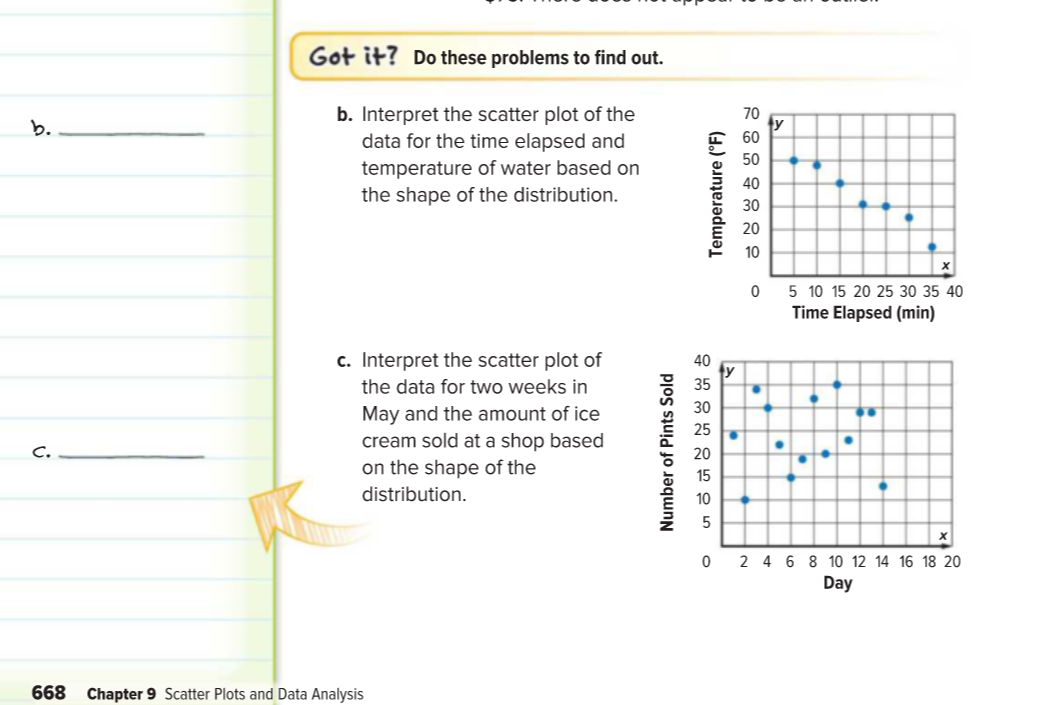
Please answer part b.
Please answer part c.