Interpret the shape of the distribution.

(Level 2)
Interpret the shape of the distribution.
![]()
(Level 2)
The association is linear.
The association is nonlinear.
Positive Association
Negative Association
No Association
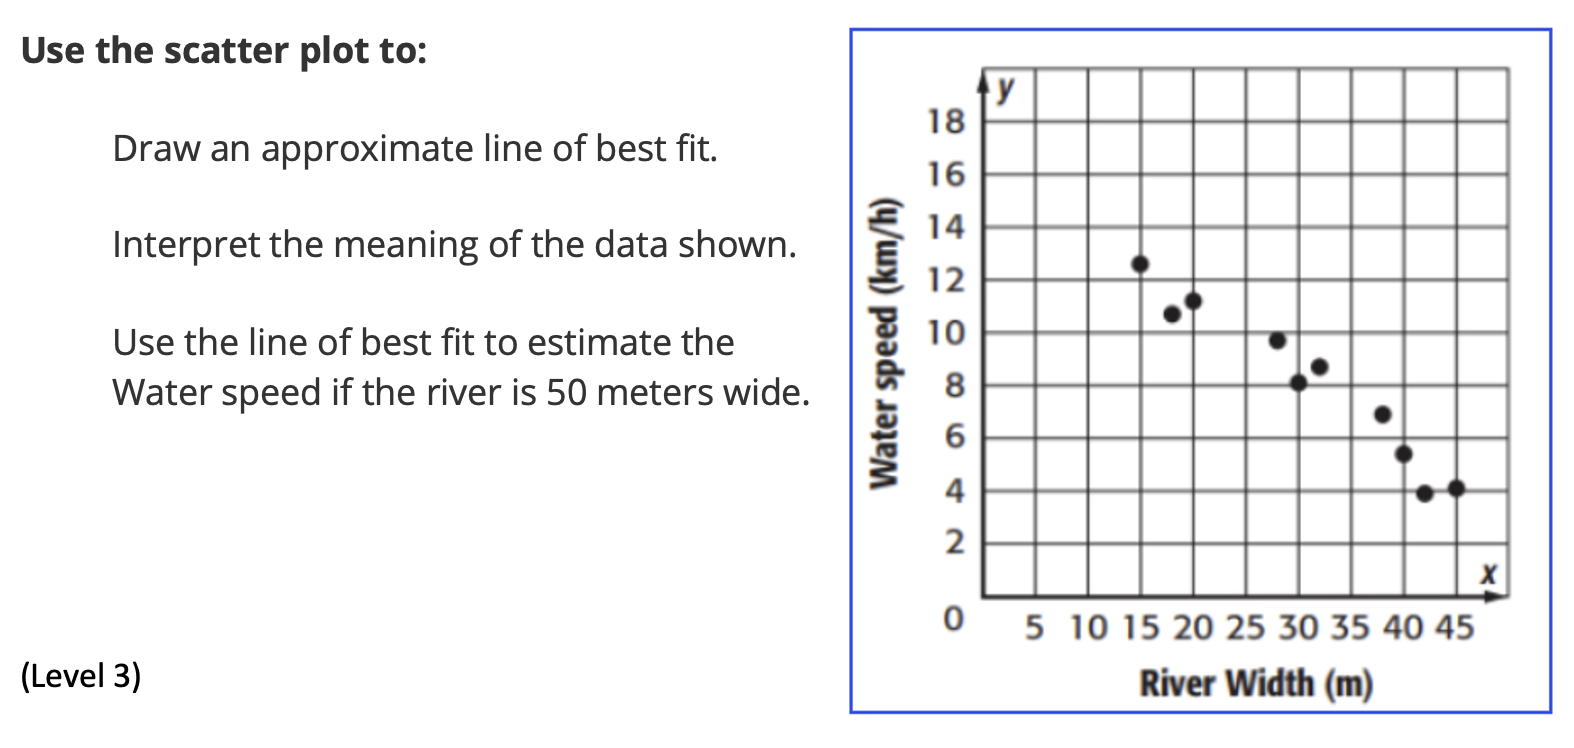
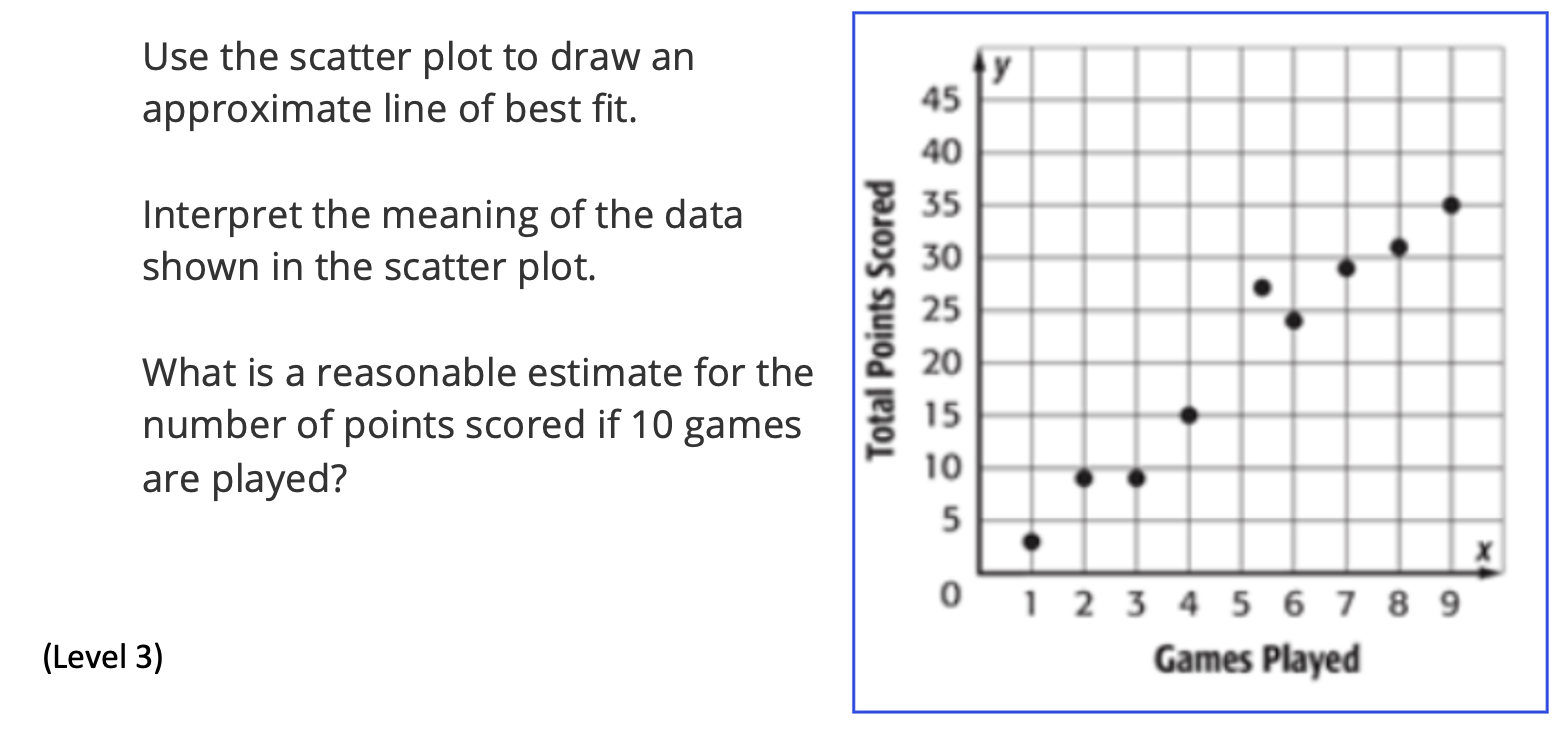
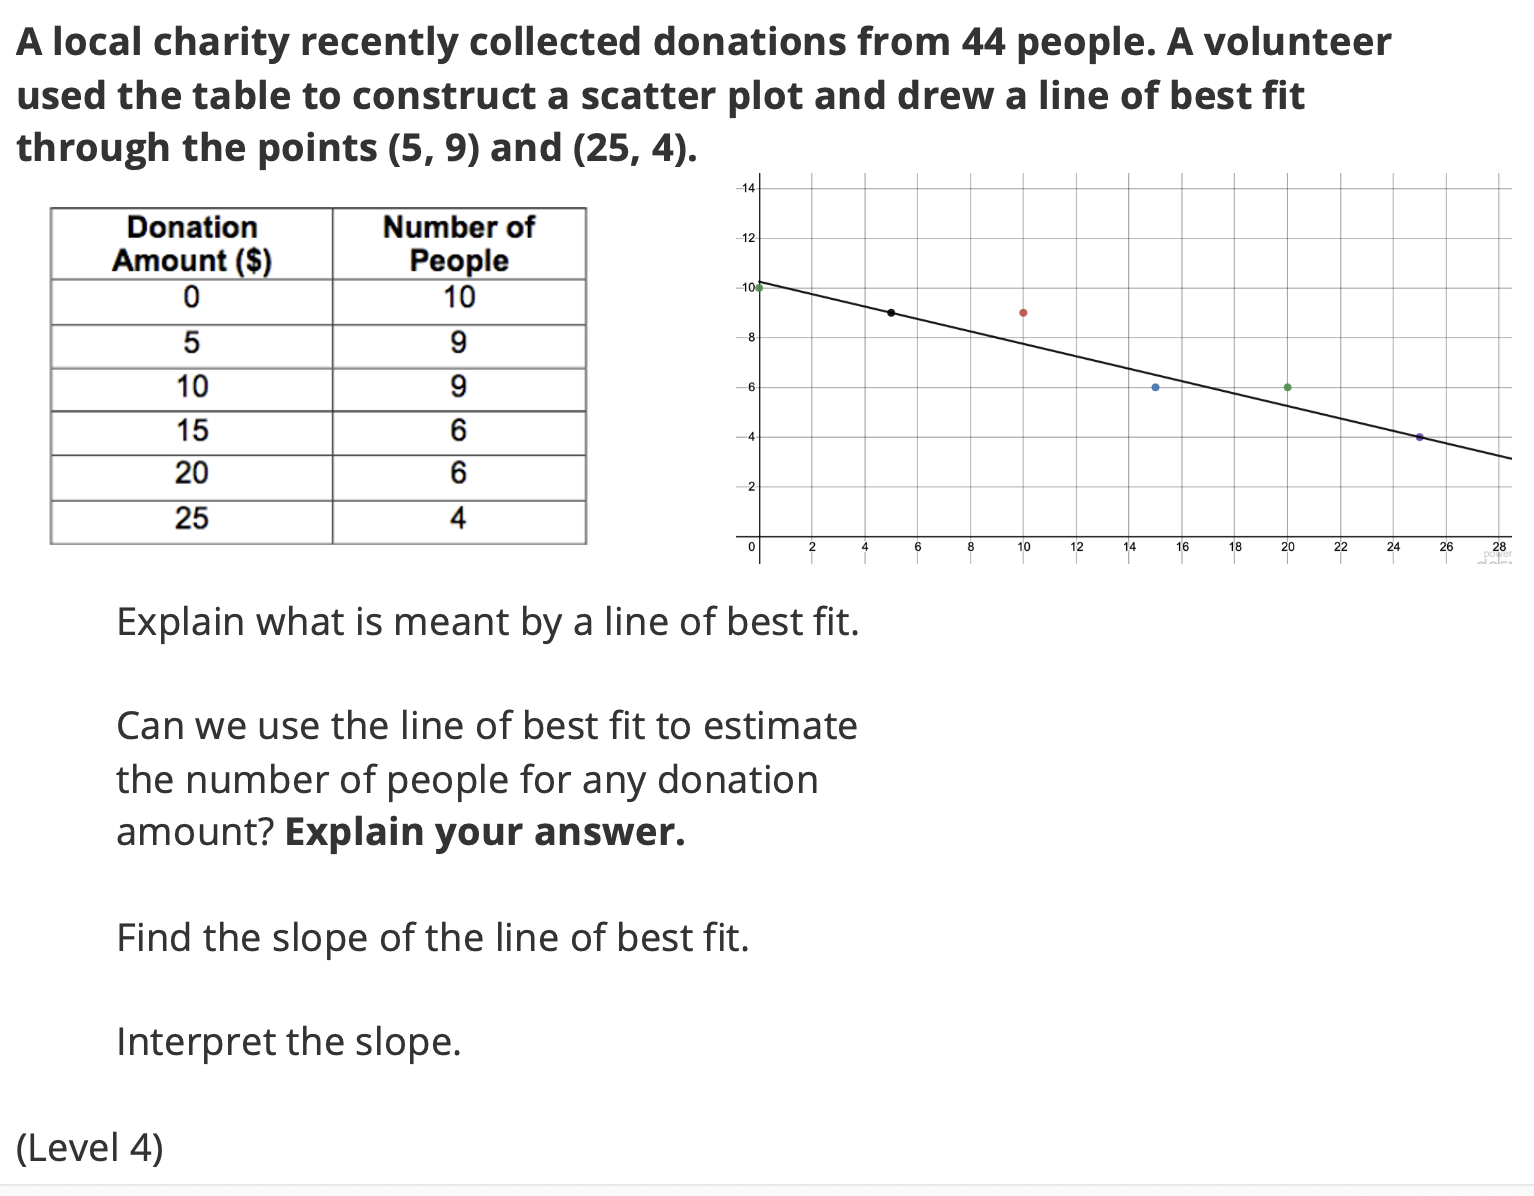
Interpret the shape of the distribution as being linear or nonlinear.
Determine whether the relation has a positive, negative, or no association.